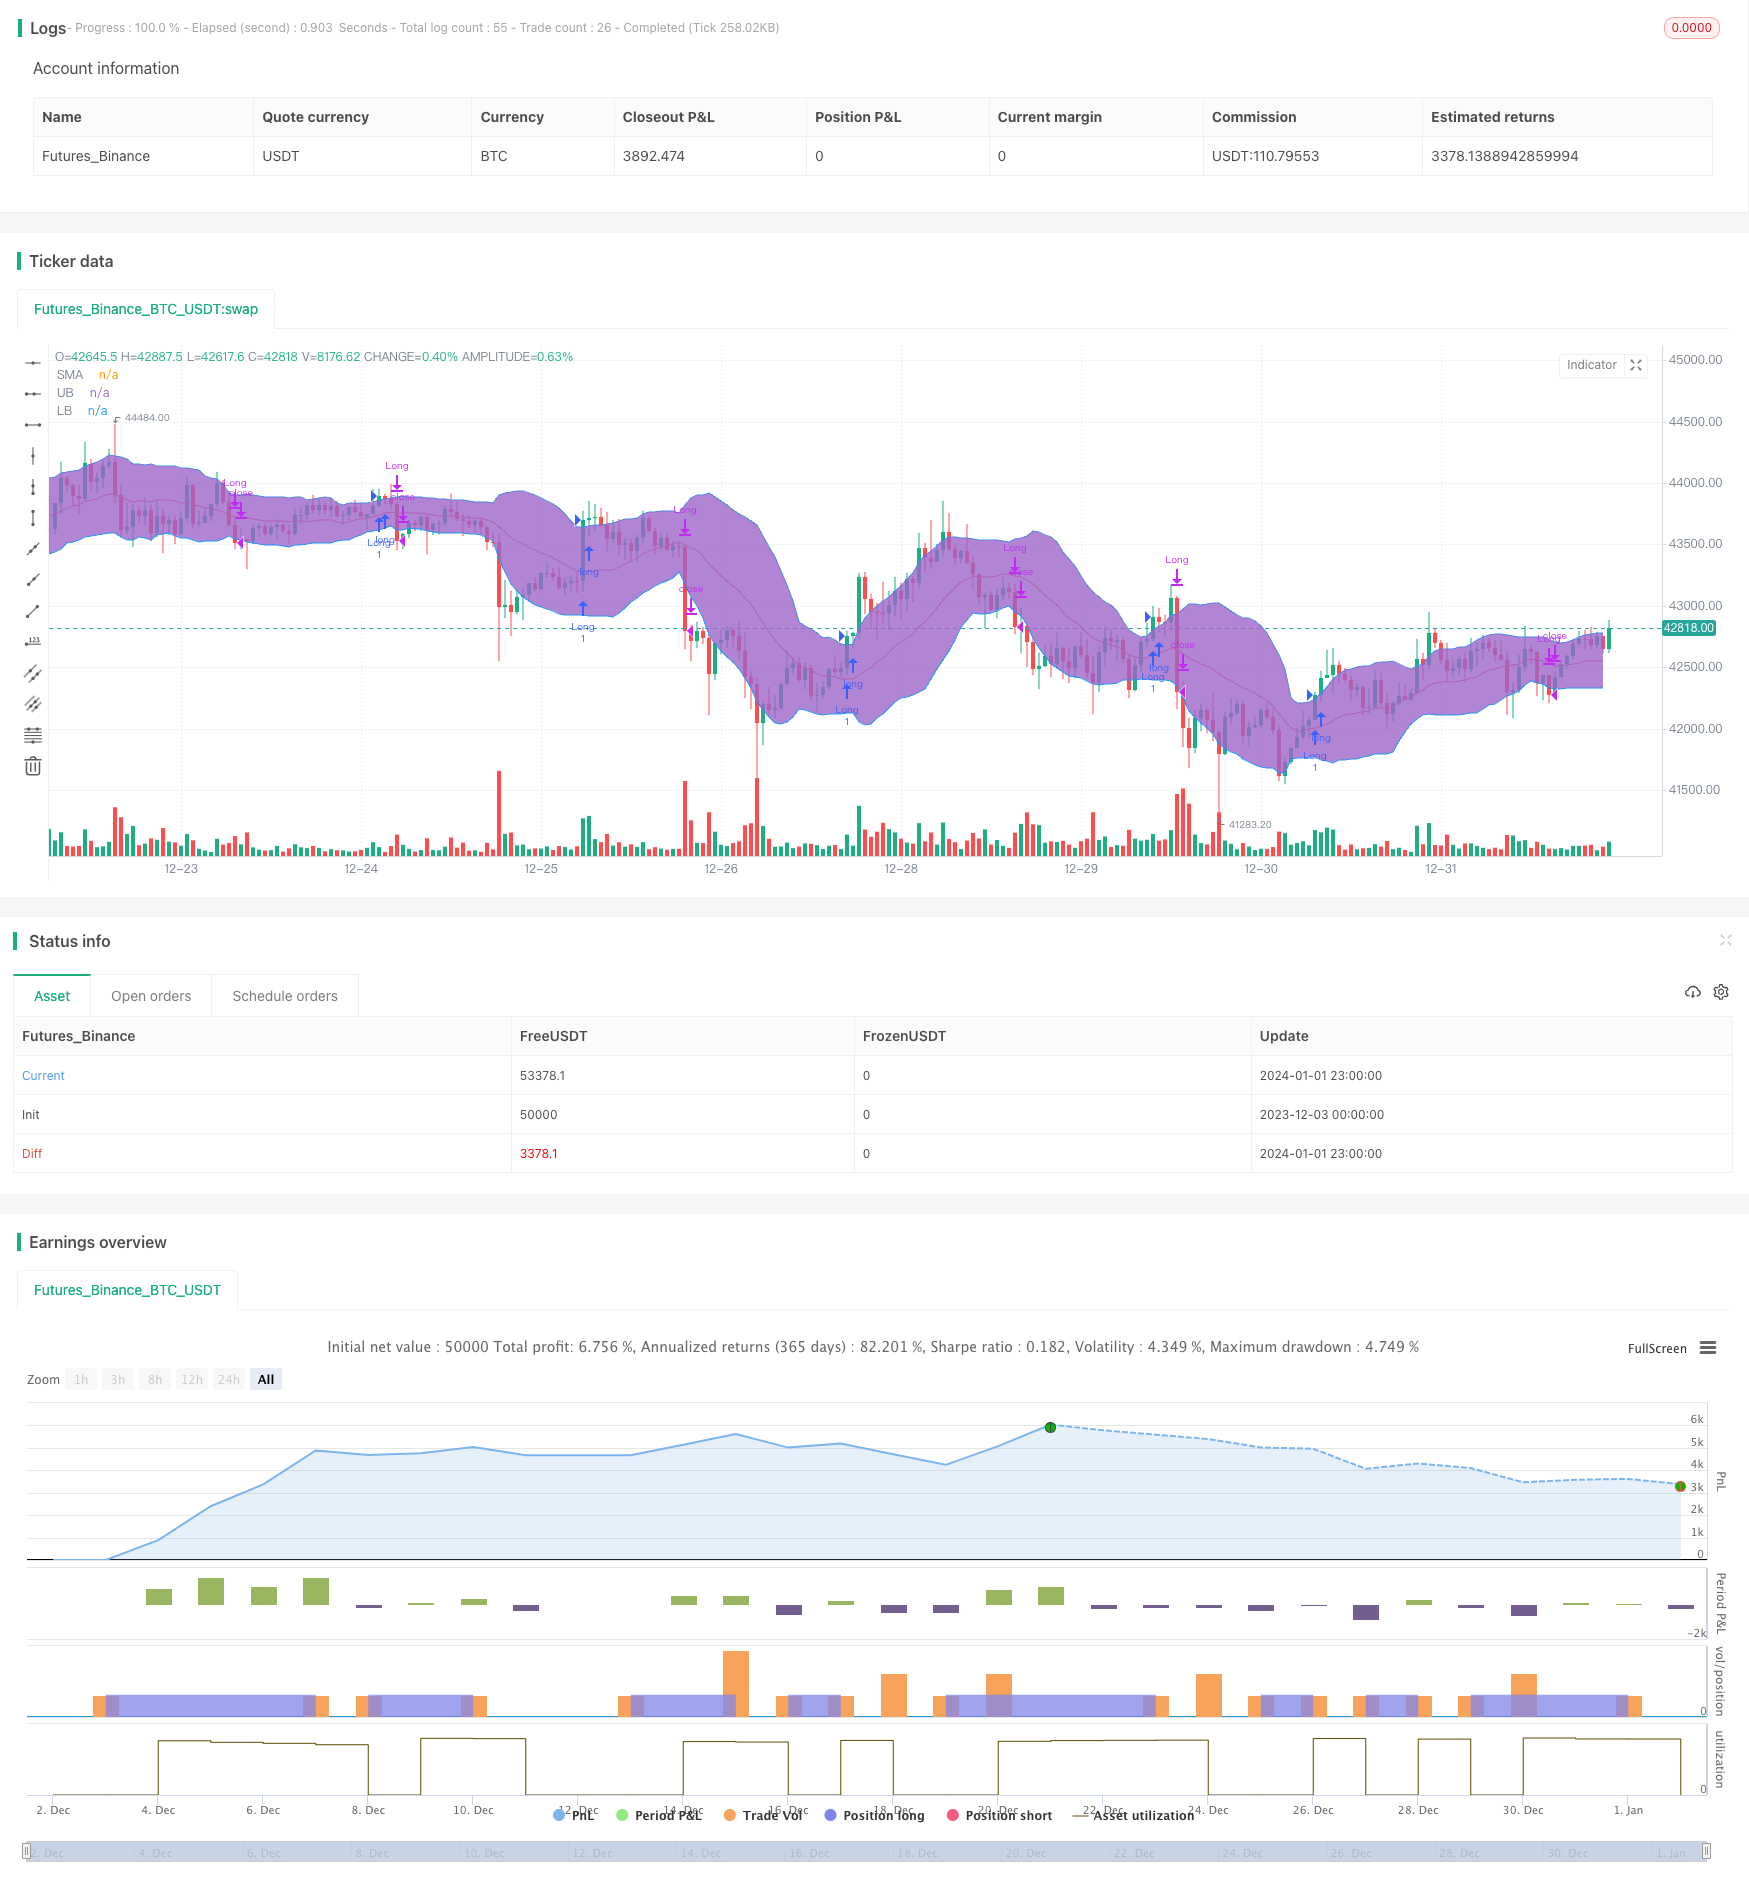
Bollinger Band Breakout Strategy

Author: ChaoZhang, Date: 2024-01-03 17:53:32
Tags:

img

Overview

The Bollinger Band breakout strategy is a trend following strategy. It uses volatility ranges to determine entry and exit points. Specifically, it uses the upper and lower bands of Bollinger Bands to judge if prices are breaking out. It goes long when prices break above the upper band and closes positions when prices break below the lower band.

Strategy Logic

The strategy is based on the Bollinger Bands indicator. Bollinger Bands contain three lines:

  1. Middle Line - n-period simple moving average
  2. Upper Band - Middle Line + k * n-period standard deviation
  3. Lower Band - Middle Line - k * n-period standard deviation.

Here k is usually set at 1.5 or 2. When prices break above the upper band, it indicates the stock is entering a strong zone and thus goes long. When prices break below the lower band, it indicates the stock is entering a weak zone and thus closes positions.

This strategy uses a 20-period middle line and 1.5 standard deviations to construct the Bollinger Bands. It goes long when prices break above the upper band. There are two options for exits:

  1. Use the lower band as a stop loss
  2. Use the middle line as a stop loss

Option 1 works better for highly volatile stocks.

Advantage Analysis

The main advantages of this strategy are:

  1. Can effectively track price trends and timely capture breakout signals
  2. Uses volatility ranges to determine entry points, which effectively filters out noise
  3. Provides two stop loss options that can be selected based on stock characteristics

Risk Analysis

This strategy also has some risks:

  1. Breakout signals may be false breakouts and fail to effectively track trends
  2. Improper stop loss positioning could lead to over-stopping out
  3. Cannot effectively handle range-bound markets

These risks can be reduced through parameter optimization, incorporating other indicators, etc.

Optimization Directions

This strategy can be optimized in several aspects:

  1. Optimize Bollinger Bands parameters to find best parameter combinations
  2. Incorporate trading volume and other indicators to verify breakout signal reliability
  3. Construct filters with other indicators to avoid false breakouts
  4. Dynamically adjust stop loss positions to lower stop loss risks

Conclusion

The Bollinger Band breakout strategy is overall a rather classical trend following strategy. It can be improved through parameter and rules optimization to better suit different market environments. The strategy is easy to understand and implement, making it a great starting point strategy choice for quantitative trading.


/*backtest
start: 2023-12-03 00:00:00
end: 2024-01-02 00:00:00
period: 1h
basePeriod: 15m
exchanges: [{"eid":"Futures_Binance","currency":"BTC_USDT"}]
*/

// This source code is subject to the terms of the Mozilla Public License 2.0 at https://mozilla.org/MPL/2.0/
// © Senthaamizh

//@version=4
strategy(title="Bollinger Band Breakout", shorttitle = "BB-BO", overlay=true)
source = close
length = input(20, minval=1, title = "Period") //Length of the Bollinger Band 
mult = input(1.5, minval=0.001, maxval=50, title = "Standard Deviation") // Use 1.5 SD for 20 period MA; Use 2 SD for 10 period MA 
exit = input(1, minval=1, maxval=2,title = "Exit Option") // Use Option 1 to exit using lower band; Use Option 2 to exit using moving average

basis = sma(source, length)
dev = mult * stdev(source, length)

upper = basis + dev
lower = basis - dev

if (crossover(source, upper))
    strategy.entry("Long", strategy.long, qty=1)

if(exit==1)
    if (crossunder(source, lower))
        strategy.close("Long")

if(exit==2) //basis is good for N50 but lower is good for BN (High volatility)
    if (crossunder(source, basis))
        strategy.close("Long")

plot(basis, color=color.red,title= "SMA")
p1 = plot(upper, color=color.blue,title= "UB")
p2 = plot(lower, color=color.blue,title= "LB")
fill(p1, p2)


More