概述
该策略使用短期和长期两个霍尔移动平均线进行交易信号的生成和过滤。短期霍尔移动平均线用于信号的生成,而长期霍尔移动平均线用于过滤信号,只有短期霍尔平均线和长期霍尔平均线同向变化的时候才会产生交易信号。
该策略同时使用ATR指标来设置止损和止盈位。每次开仓时,会根据ATR的值来动态设置当前头寸的止损位和止盈位。
策略原理
短期霍尔移动平均线用于捕捉价格的短期趋势和转折点。当短期霍尔移动平均线的方向发生转变时,说明价格的短期趋势发生了改变。
长期霍尔移动平均线用于判断价格的总体走势。例如,当长期霍尔移动平均线的方向为上升时,说明价格处于总体上升趋势中。
只有当短期霍尔移动平均线发生转折,并且其转折方向与长期霍尔移动平均线的总体走势方向一致时,才会产生交易信号。也就是说,只在价格短期趋势转变的同时,总体走势也在同一方向变化时,才对这一短期信号进行交易。这可以有效过滤掉短期市场噪音造成的错误信号。
在开仓建立头寸后,会根据ATR指标的大小来设定止损位和止盈位。ATR指标能反映市场的波动程度和风险水平。止损位置会放置在价格低点之下,而止盈位置会放置在价格高点之上,并且都会与ATR值挂钩,根据市场波动程度来调整止损止盈的范围。
优势分析
该策略结合了短期信号和长期过滤,能有效识别价格中期的趋势,并及时捕捉转折点。相比单一的移动平均线等指标,可以减少被市场噪音欺骗的可能性。
动态调整止损止盈位置,可以根据市场波动程度来设置合理的止损止盈位,在保证盈利的同时避免过于激进,减小亏损风险。
借助霍尔移动平均线的优点,可以更加灵活和准确的判断价格走势,相比普通移动平均线具有更强的跟踪性能。
风险分析
该策略依赖短期和长期两个霍尔移动平均线的交叉作为信号,如果两个移动平均线之间产生假交叉,可能会造成错误的入场。这时就需要根据长短期市场结构来决定是否过滤该信号。
在震荡行情中,价格可能在一个较小的交易范围内来回震荡,这会增加信号错误率和增加无谓交易的可能。这时可以通过扩大交易信号过滤条件来避免无谓交易。
止损止盈设置依赖于ATR指标,如果ATR指标反映的市场波动不准确,止损止盈位置也会失效。这时可以考虑结合其他波动率指标来修正ATR值。
优化方向
可以考虑结合其他短期指标来辅助信号判断,例如RSI等超买超卖指标,从而提高过滤效果。
可以增加或优化长短期霍尔移动平均线之间的过滤逻辑关系,使过滤规则更加严格,避免出现错误信号。
可以研究不同的参数设置对策略稳定性和盈利情况的影响。例如移动平均线参数、ATR参数等的不同组合可以产生不同的交易绩效。
总结
本策略综合利用了短期霍尔移动平均线捕捉信号、长期霍尔移动平均线进行信号过滤和ATR指标设定止损止盈的方法,形成了一套较为完整的中期趋势跟踪策略体系。该策略能有效发现中期价格转折点,避免被短期市场噪音干扰,是建立趋势交易体系的重要选股工具。通过参数优化和辅助条件添加,本策略可以进一步增强信号判断准确性,从而获得更好的绩效表现。
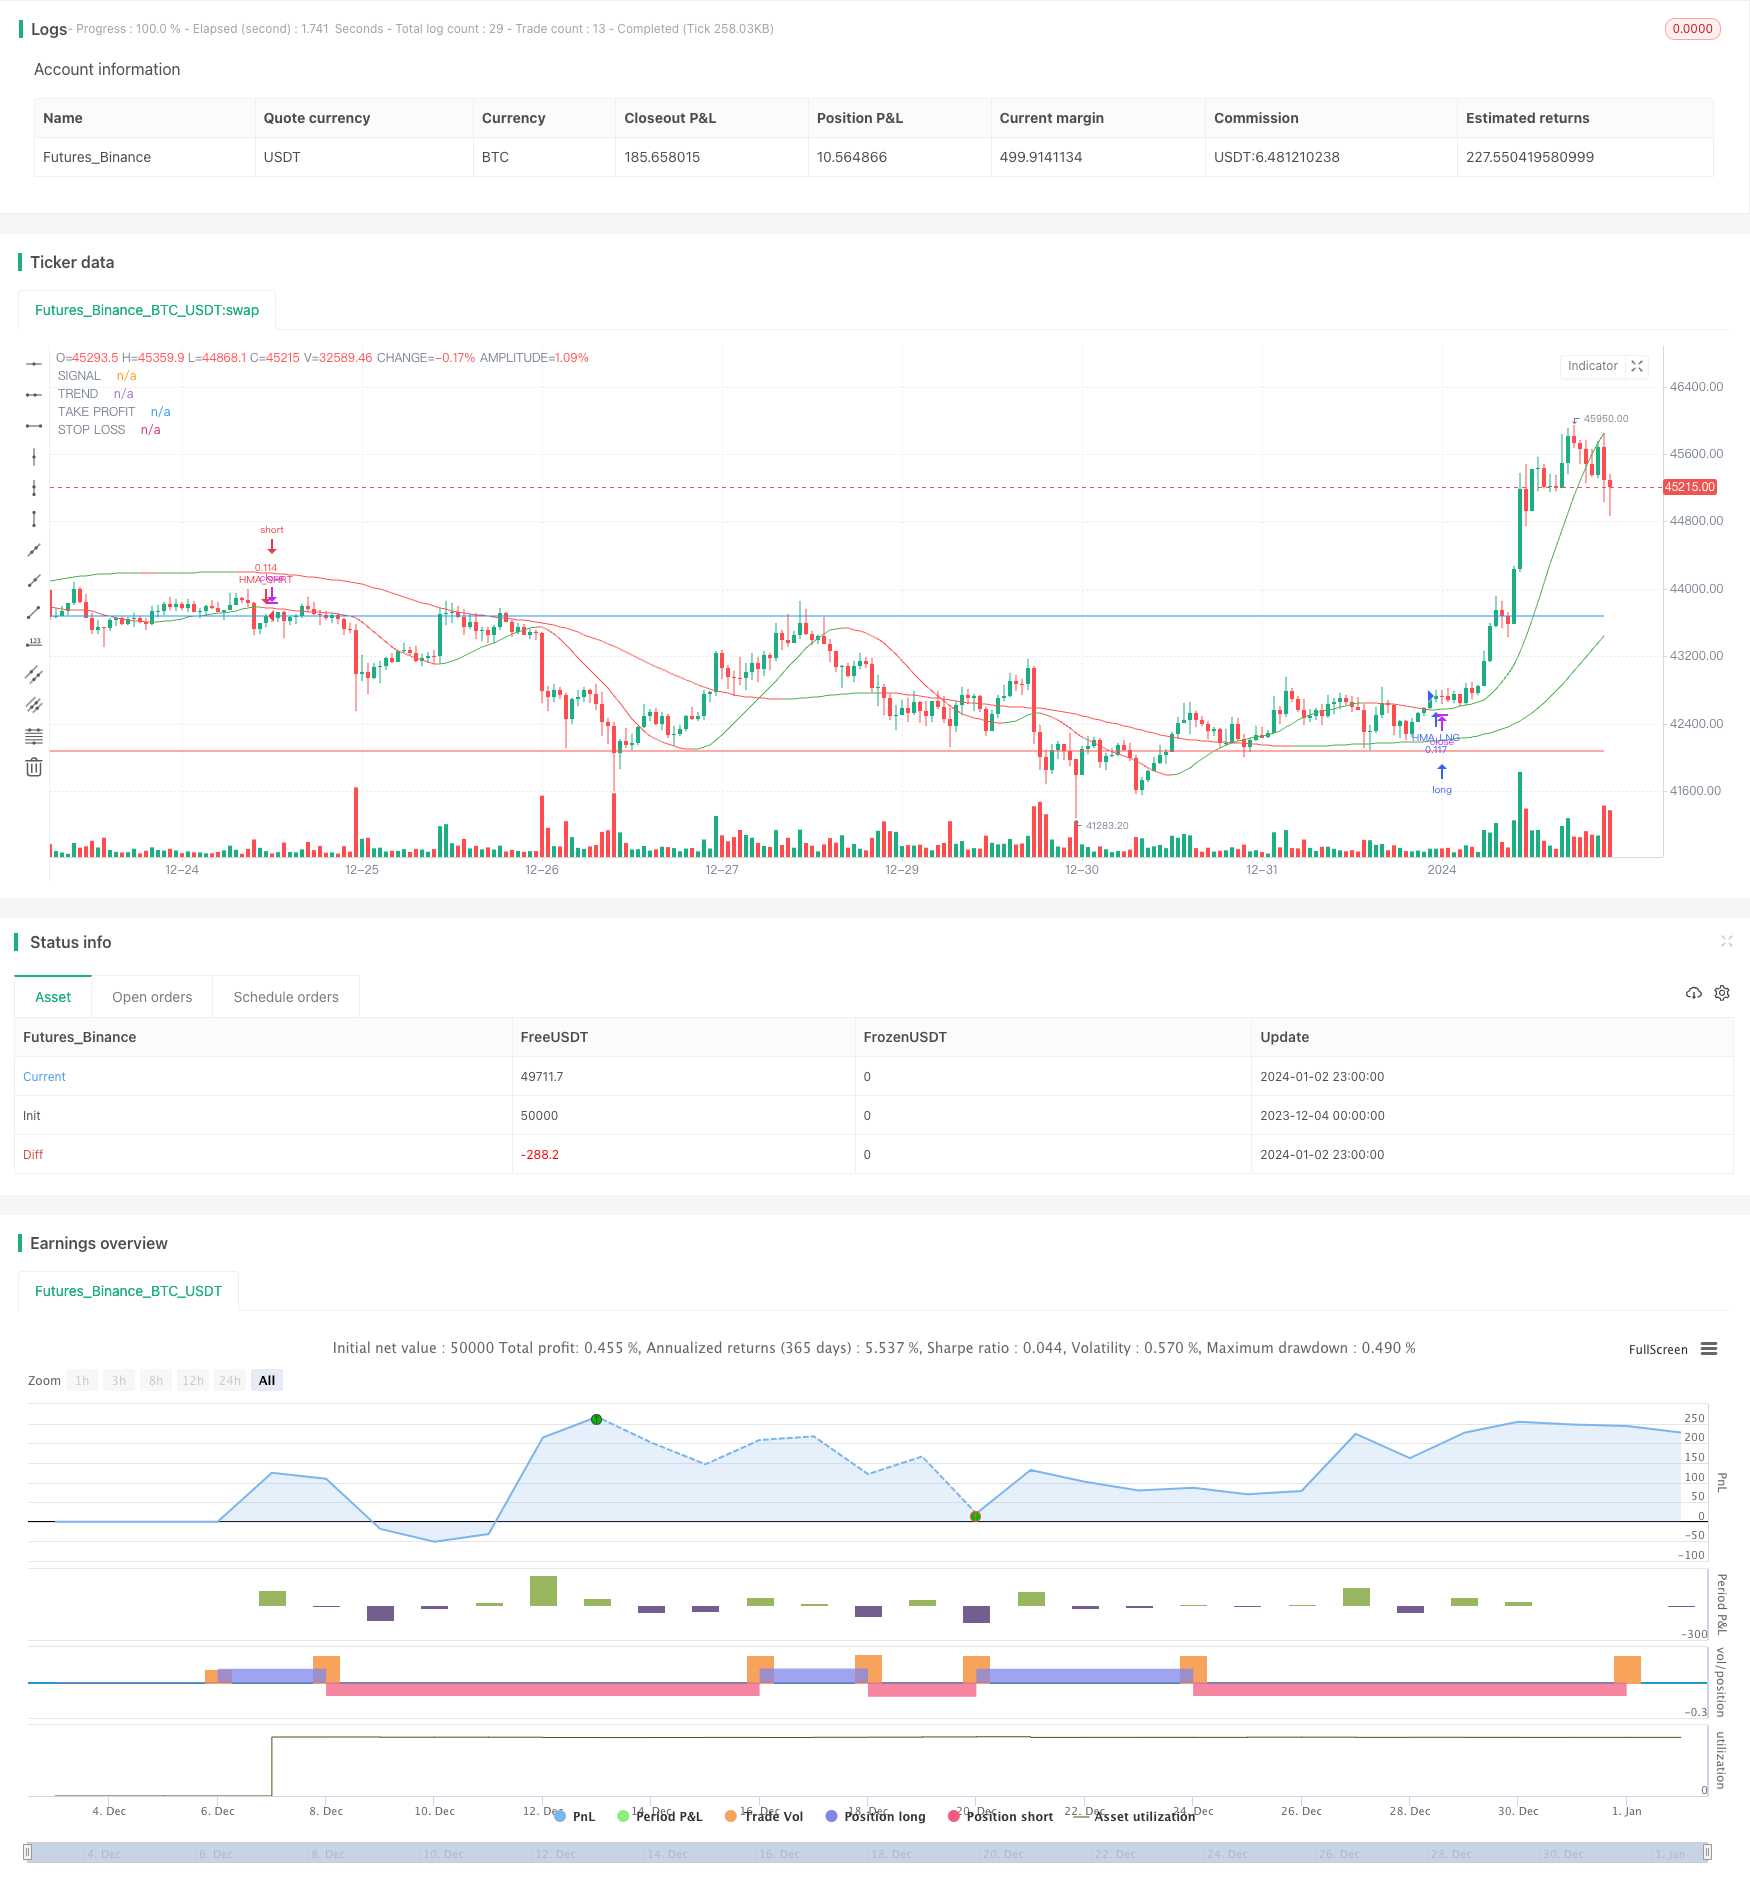
/*backtest
start: 2023-12-04 00:00:00
end: 2024-01-03 00:00:00
period: 1h
basePeriod: 15m
exchanges: [{"eid":"Futures_Binance","currency":"BTC_USDT"}]
*/

//@version=4
strategy("Hull Filtered Strategy", overlay=true, pyramiding=0, default_qty_type= strategy.percent_of_equity, default_qty_value = 10, calc_on_order_fills=false, slippage=0,commission_type=strategy.commission.percent,commission_value=0)

// Parameters for Hull Moving Averages
src = input(close, title="Source")
signal_period = input(50, title="Period of signal HMA")
filter_period = input(200, title="Period of filter HMA")

strat_dir_input = input(title="Strategy Direction", defval="all", options=["long", "short", "all"])

// Set allowed trading directions
strat_dir_value = strat_dir_input == "long" ? strategy.direction.long : strat_dir_input == "short" ? strategy.direction.short : strategy.direction.all
strategy.risk.allow_entry_in(strat_dir_value)

// stop loss and take profit
sl_factor = input(2,title="Stop Loss Factor")
tp_factor = input(3,title="Take Profit Factor")
atr_period = input(14, title="ATR Period (SL/TP)")

// Testing Start dates
testStartYear = input(2010, "Backtest Start Year")
testStartMonth = input(1, "Backtest Start Month")
testStartDay = input(1, "Backtest Start Day")
testPeriodStart = timestamp(testStartYear,testStartMonth,testStartDay,0,0)

//Stop date if you want to use a specific range of dates
testStopYear = input(2030, "Backtest Stop Year")
testStopMonth = input(12, "Backtest Stop Month")
testStopDay = input(31, "Backtest Stop Day")
testPeriodStop = timestamp(testStopYear,testStopMonth,testStopDay,0,0)


// -----------------------------------------------------------------------------
// Global variables
// -----------------------------------------------------------------------------
var float tp = na
var float sl = na
var float position = na


// -----------------------------------------------------------------------------
// Functions
// -----------------------------------------------------------------------------
testWindow() =>
    time >= testPeriodStart and time <= testPeriodStop ? true : false


// -----------------------------------------------------------------------------
// The engine
// -----------------------------------------------------------------------------
hma_signal = hma(src, signal_period)
hma_filter = hma(src, filter_period)

// Used to determine exits and stop losses
atr_e = atr(atr_period)

// if hma_filter increases hma_trend is set to 1, if it decreases hma_trend is set to -1. If no trend is available, hma_trend is set to ß0
trend = hma_filter > hma_filter[1]  ?  1 : hma_filter < hma_filter[1] ? -1 : 0
signal = hma_signal > hma_signal[1] ? 1 : hma_signal  < hma_signal[1] ? -1 : 0


// -----------------------------------------------------------------------------
// signals
// -----------------------------------------------------------------------------
if signal[0] == 1 and signal[1] != 1 and trend == 1 and testWindow()
    sl := close - sl_factor*atr_e
    tp := close + tp_factor*atr_e
    strategy.entry("HMA_LNG", strategy.long)
    strategy.exit("LE", "HMA_LNG", profit=100*tp_factor*atr_e, loss=100*sl_factor*atr_e)

if signal[0] == -1 and signal[1] != -1 and trend == -1 and testWindow()
    sl := close + sl_factor*atr_e
    tp := close - tp_factor*atr_e
    strategy.entry("HMA_SHRT", strategy.short)
    strategy.exit("SE", "HMA_SHRT", profit=100*tp_factor*atr_e, loss=100*sl_factor*atr_e)


if strategy.position_size != 0
    sl := sl[1]
    tp := tp[1]

// -----------------------------------------------------------------------------
// PLOT
// -----------------------------------------------------------------------------
hma_s = plot(hma_signal, title="SIGNAL", color = signal == 1 ? color.green : color.red)
hma_l = plot(hma_filter, title="TREND", color = trend == 1 ? color.green : color.red)

plot(tp, title="TAKE PROFIT", color= strategy.position_size != 0 ? color.blue: na, linewidth=1)
plot(sl, title="STOP LOSS", color= strategy.position_size != 0 ? color.red: na, linewidth = 1)