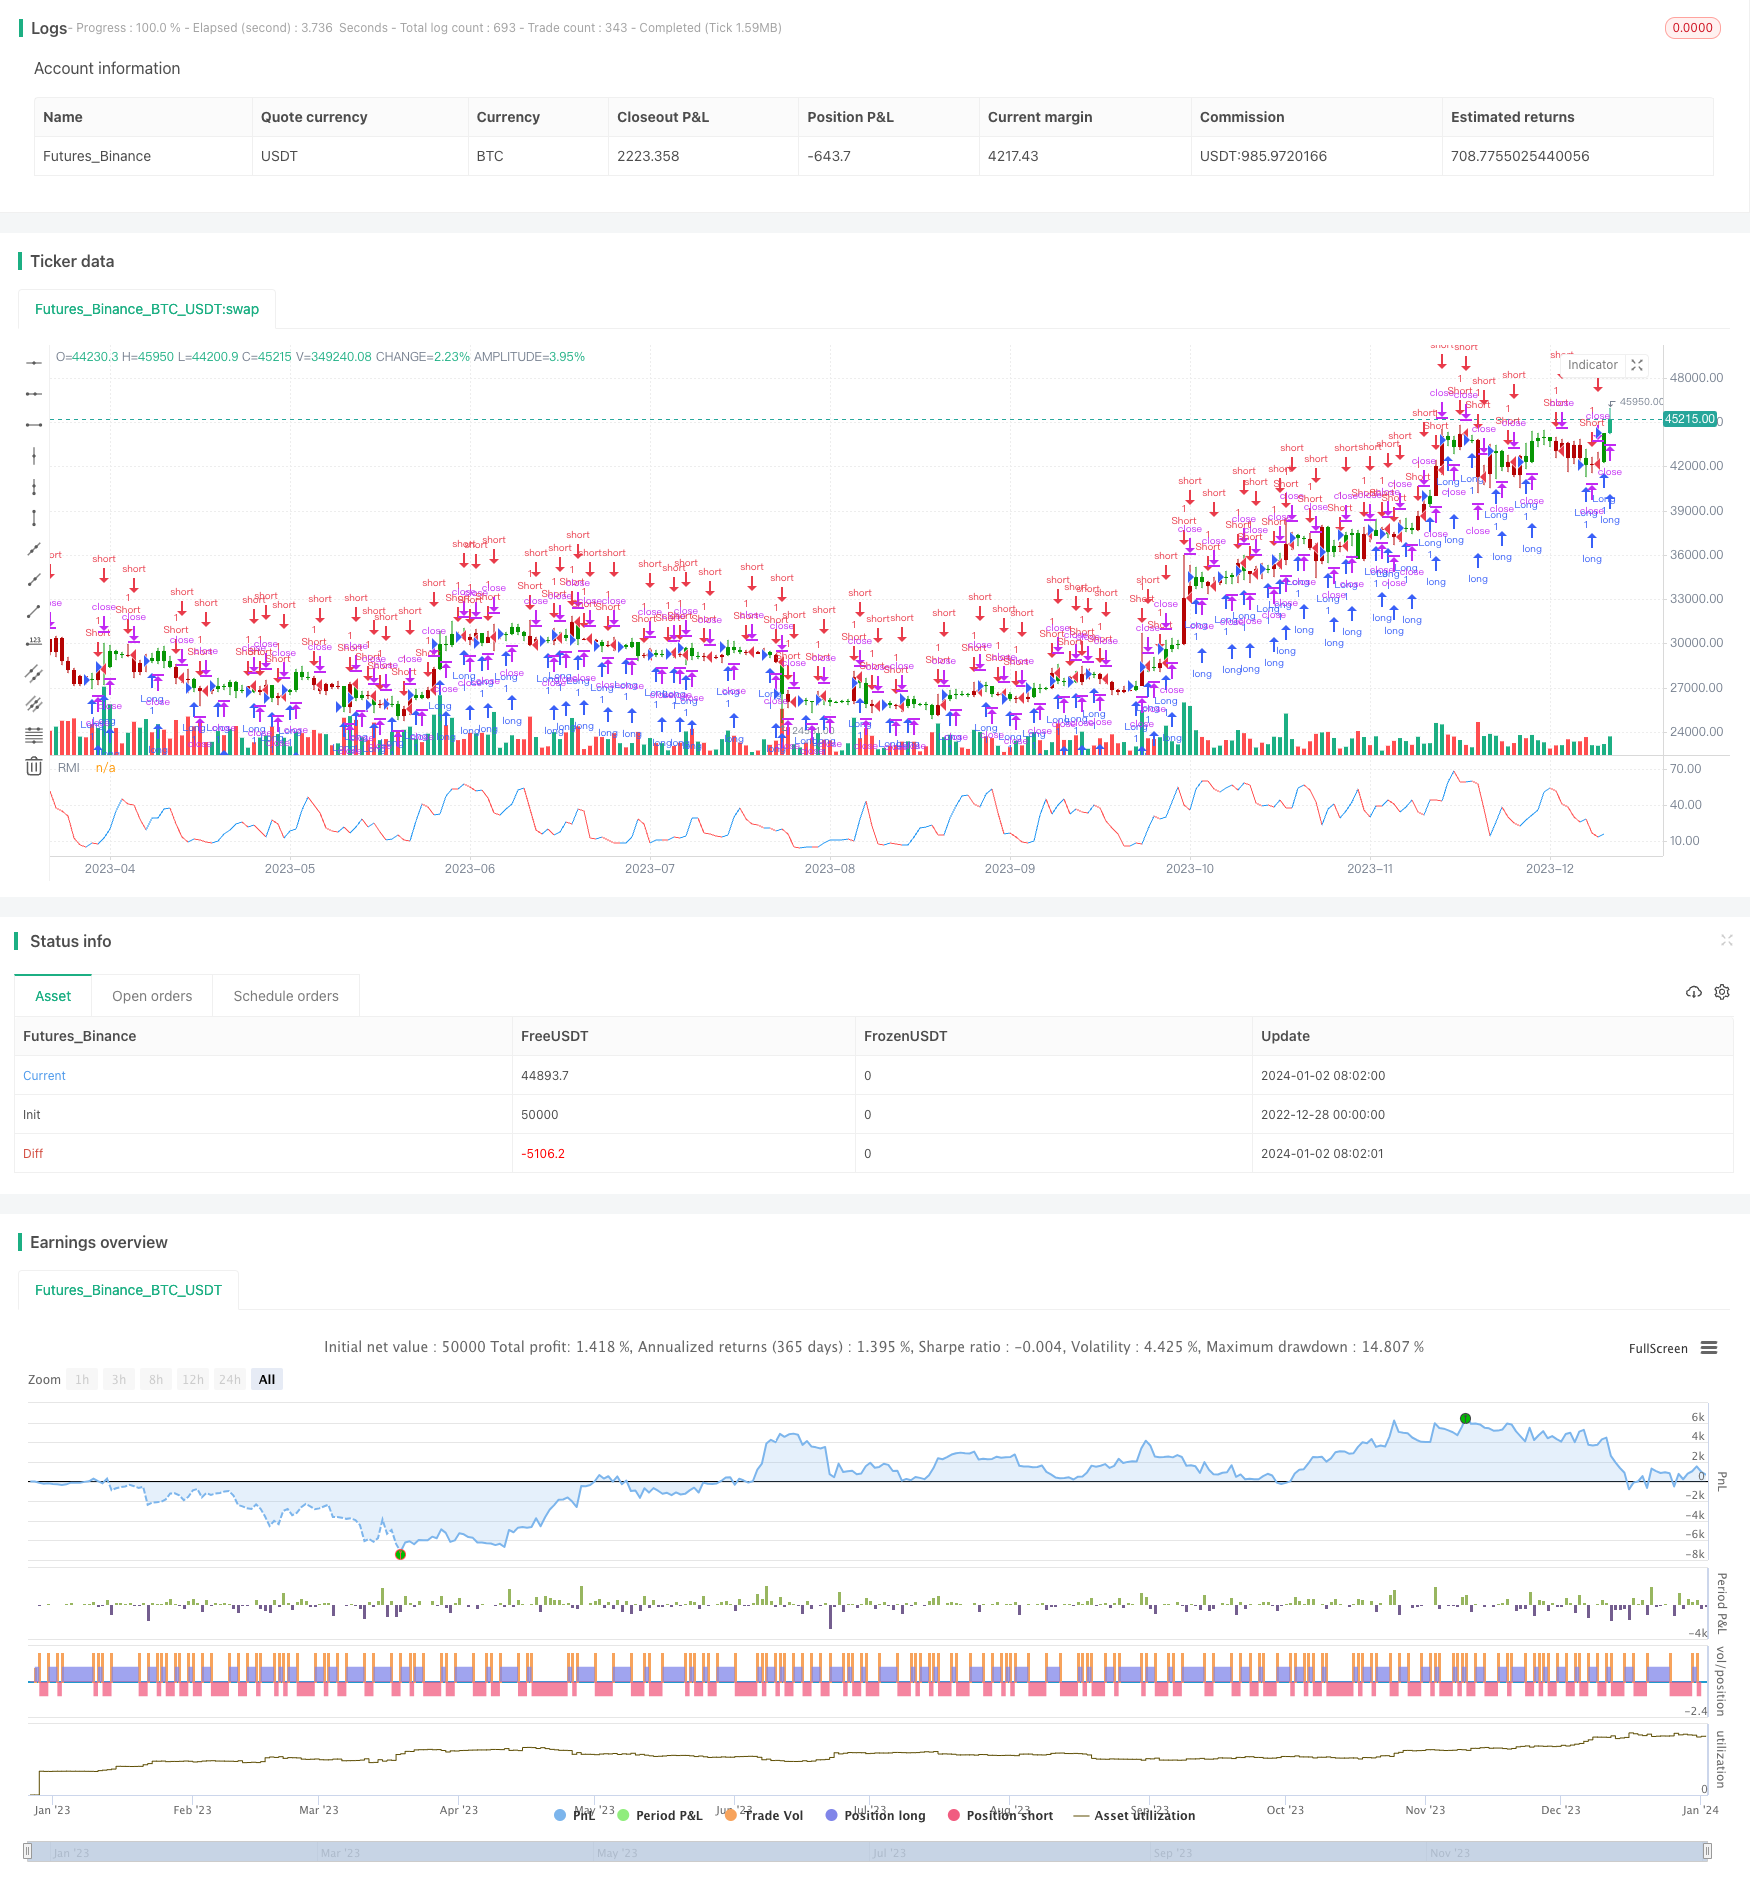
概述
动量趋势跟踪策略(Momentum Trend Tracking Strategy)是一个利用相对强度指数(RSI)、随机指标(Stochastic)和动量指标(Momentum)来识别趋势的策略。它综合多个指标信号,回测效果良好,适合中长线持仓。
策略原理
该策略首先分别计算长度为9周期的RSI、Stochastic和Momentum指标。然后把Stochastic和RSI的数值相乘,再除以Momentum,得到一个综合指标,即KNRP。该指标能够同时反映多个子指标的信息。
之后,对KNRP求长度为2的移动平均,当其上穿下穿时生成交易信号。即当平均值大于前一周期时做多,小于前一周期时做空。该信号反映了KNRP指标的短期趋势。
优势分析
该策略最大的优势是指标设计合理,有效地结合了多种技术指标的信息,能够准确判断趋势的走向。相比单一指标,它减少了错误信号的概率,提高了信号的可靠性。
另外,该策略判断趋势的主要依据是KNRP的移动平均,避免了追高杀跌的风险,符合趋势交易的理念。此外,参数设置灵活,用户可以根据自己的风格进行调整。
风险分析
该策略主要的风险在于多指标组合本身。如果组合方式不当,不同指标之间可能会出现冲突。这会增加错误信号,影响策略表现。此外,参数设置不当也会对结果产生较大影响。
为降低风险,建议优化参数,测试不同长度和组合方式的参数对策略指标和整体回测结果的影响。另外也需要关注长期行情对参数稳定性的影响。
优化方向
该策略主要可以从以下几个方面进行优化:
测试更多种类的技术指标的组合,寻找更有效判断趋势的方式
对指标参数进行优化,找到对现有市场环境更适合的数值
添加止损、止盈逻辑,以锁定利润、减少亏损
在更长的时间周期如日线或周线上测试,评估作为中长线策略的效果
添加仓位管理模块,根据市场情况调整仓位
总结
动量趋势跟踪策略整体来说是一种较为稳定可靠的趋势策略。它解决了单一指标易受假信号影响的缺点,通过加权多指标有效判断趋势。参数设置灵活、优化空间较大,适合技术指标 traders。如果进一步完善,该策略有望成为一个值得长期持有的量化策略。
/*backtest
start: 2022-12-28 00:00:00
end: 2024-01-03 00:00:00
period: 1d
basePeriod: 1h
exchanges: [{"eid":"Futures_Binance","currency":"BTC_USDT"}]
*/

//@version=4
////////////////////////////////////////////////////////////
//  Copyright by HPotter v1.0 27/07/2021
// To calculate the coordinates in which the kink of the line will cross,
//the standard Forex instruments are used - Relative Strenght Index, Stochastic and Momentum.
//It is very easy to optimize them for the existing trading strategy: they all have very
//flexible and easily customizable parameters. Signals to enter the market can be 2 situations:
//    Change of color of the indicator line from red to blue. At the same time, it is worth entering into the purchase;
//    Change of color of the indicator line from blue to red. In this case, it is worth entering for sale.
//The signals are extremely clear and can be used in practice even by beginners. The indicator
//itself shows when to make deals: the user only has to accompany them and set the values
//of Take Profit and Stop Loss. As a rule, the signal to complete trading is the approach of
//the indicator level to the levels of the maximum or minimum of the previous time period.
////////////////////////////////////////////////////////////
strategy(title="Kwan NRP Backtest", shorttitle="KNRP")
xPrice = open
Length_Momentum = input(9, minval=1)
Length_RSI = input(9, minval=1)
Length_Stoch = input(9, minval = 1)
Length_NRP = input(2, minval=1)
reverse = input(false, title="Trade reverse")
var xKNRP = array.new_float(1,na)
xMom = close / close[Length_Momentum] * 100
xRSI = rsi(xPrice, Length_RSI)
xStoch = stoch(xPrice, high, low, 9)
if xMom != 0
    val=xStoch*xRSI/xMom
    array.push(xKNRP,val)
    nz(na)
avr = 0.0
if array.size(xKNRP) > Length_NRP
    for i = array.size(xKNRP)-Length_NRP to array.size(xKNRP)-1
	    avr+= array.get(xKNRP, i)
    nz(na)
avr := avr / Length_NRP
clr = avr > avr[1] ? color.blue : color.red
pos = iff(avr > avr[1] , 1,
	   iff(avr < avr[1], -1, 0))
possig = iff(reverse and pos == 1, -1,
          iff(reverse and pos == -1 , 1, pos))
if (possig == 1 )
    strategy.entry("Long", strategy.long)
if (possig == -1 )
    strategy.entry("Short", strategy.short)
if (possig == 0)
    strategy.close_all()
barcolor(possig == -1 ? #b50404: possig == 1 ? #079605 : #0536b3 )
plot(avr, color=clr, title="RMI")