概述
动量布林带突破策略(Momentum Bollinger Bands Breakout Strategy)是一个融合布林带指标和移动平均线指标,在一定动量条件下进行突破操作的量化交易策略。该策略主要利用布林带的高低轨对价格进行界定,结合移动平均线进行额外的价格过滤,在一定动量条件下发出买卖信号,进行布林带上轨和下轨的突破操作。
策略原理
该策略主要基于布林带指标和移动平均线MA指标,布林带以及移动平均线属于趋势跟踪型指标。布林带利用标准差概念,描绘出价格的高低波动范围。移动平均线平滑价格数据,判断价格趋势方向。
策略的核心逻辑:
初始化布林带参数,计算出中轨、上轨、下轨。
初始化移动平均线参数。
买入信号:当价格从下向上突破布林带下轨且移动平均线位于下轨之下时,做多。
卖出信号:当价格从上向下突破布林带上轨且移动平均线位于上轨之上时,做空。
退出信号:价格重新进入布林带范围时,平仓。
该策略综合运用布林带指标和移动平均线指标,在一定动量条件下产生交易信号,属于典型的趋势跟踪策略。
策略优势
利用布林带清晰判断价格波动范围,移动平均线判断价格趋势方向,结合双重指标过滤,形成的交易信号具有较高的可靠性。
在价格突破布林带边界的同时,要求移动平均线也突破,保证具备足够的动量支撑,避免假突破。
策略参数设置合理灵活,可以调整布林带参数和移动平均线周期,适应不同品种和行情环境。
策略思路清晰易理解,容易实施和验证。
策略风险
布林带波动指标本身对市场波动具有潜在的滞后性,在快速变化的趋势中可能会产生失效的交易信号。
移动平均线作为过滤指标时,其参数设置会直接影响策略频率。参数设置不当可能导致错过交易机会。
需要同时依赖布林带指标和移动平均线指标形成有效信号,一旦其中之一失效,整个策略会受到影响。
突破类策略较为激进,当价格出现回调试验布林带边界时,容易被套住。
策略优化方向
优化布林带参数,适应不同周期和波动度的品种,如修改布林带周期、标准差倍数参数。
优化移动平均线周期参数,平衡频率与过滤效果。
增加止损策略,以控制单笔交易的最大亏损。
结合其它指标,如RSI、MACD等形成组合指标,丰富策略交易信号。
结合机器学习模型,辅助判断价格趋势方向和破防成功率。
总结
本策略整合布林带指标与移动平均线指标,在确保一定价格突破动量的前提下,产生入市和出市信号。策略思路清晰,易于实施,能够有效跟踪趋势性行情。但同时也存在一定回撤风险,需要针对参数设置与止损方面进行优化,以适应市场的变化。
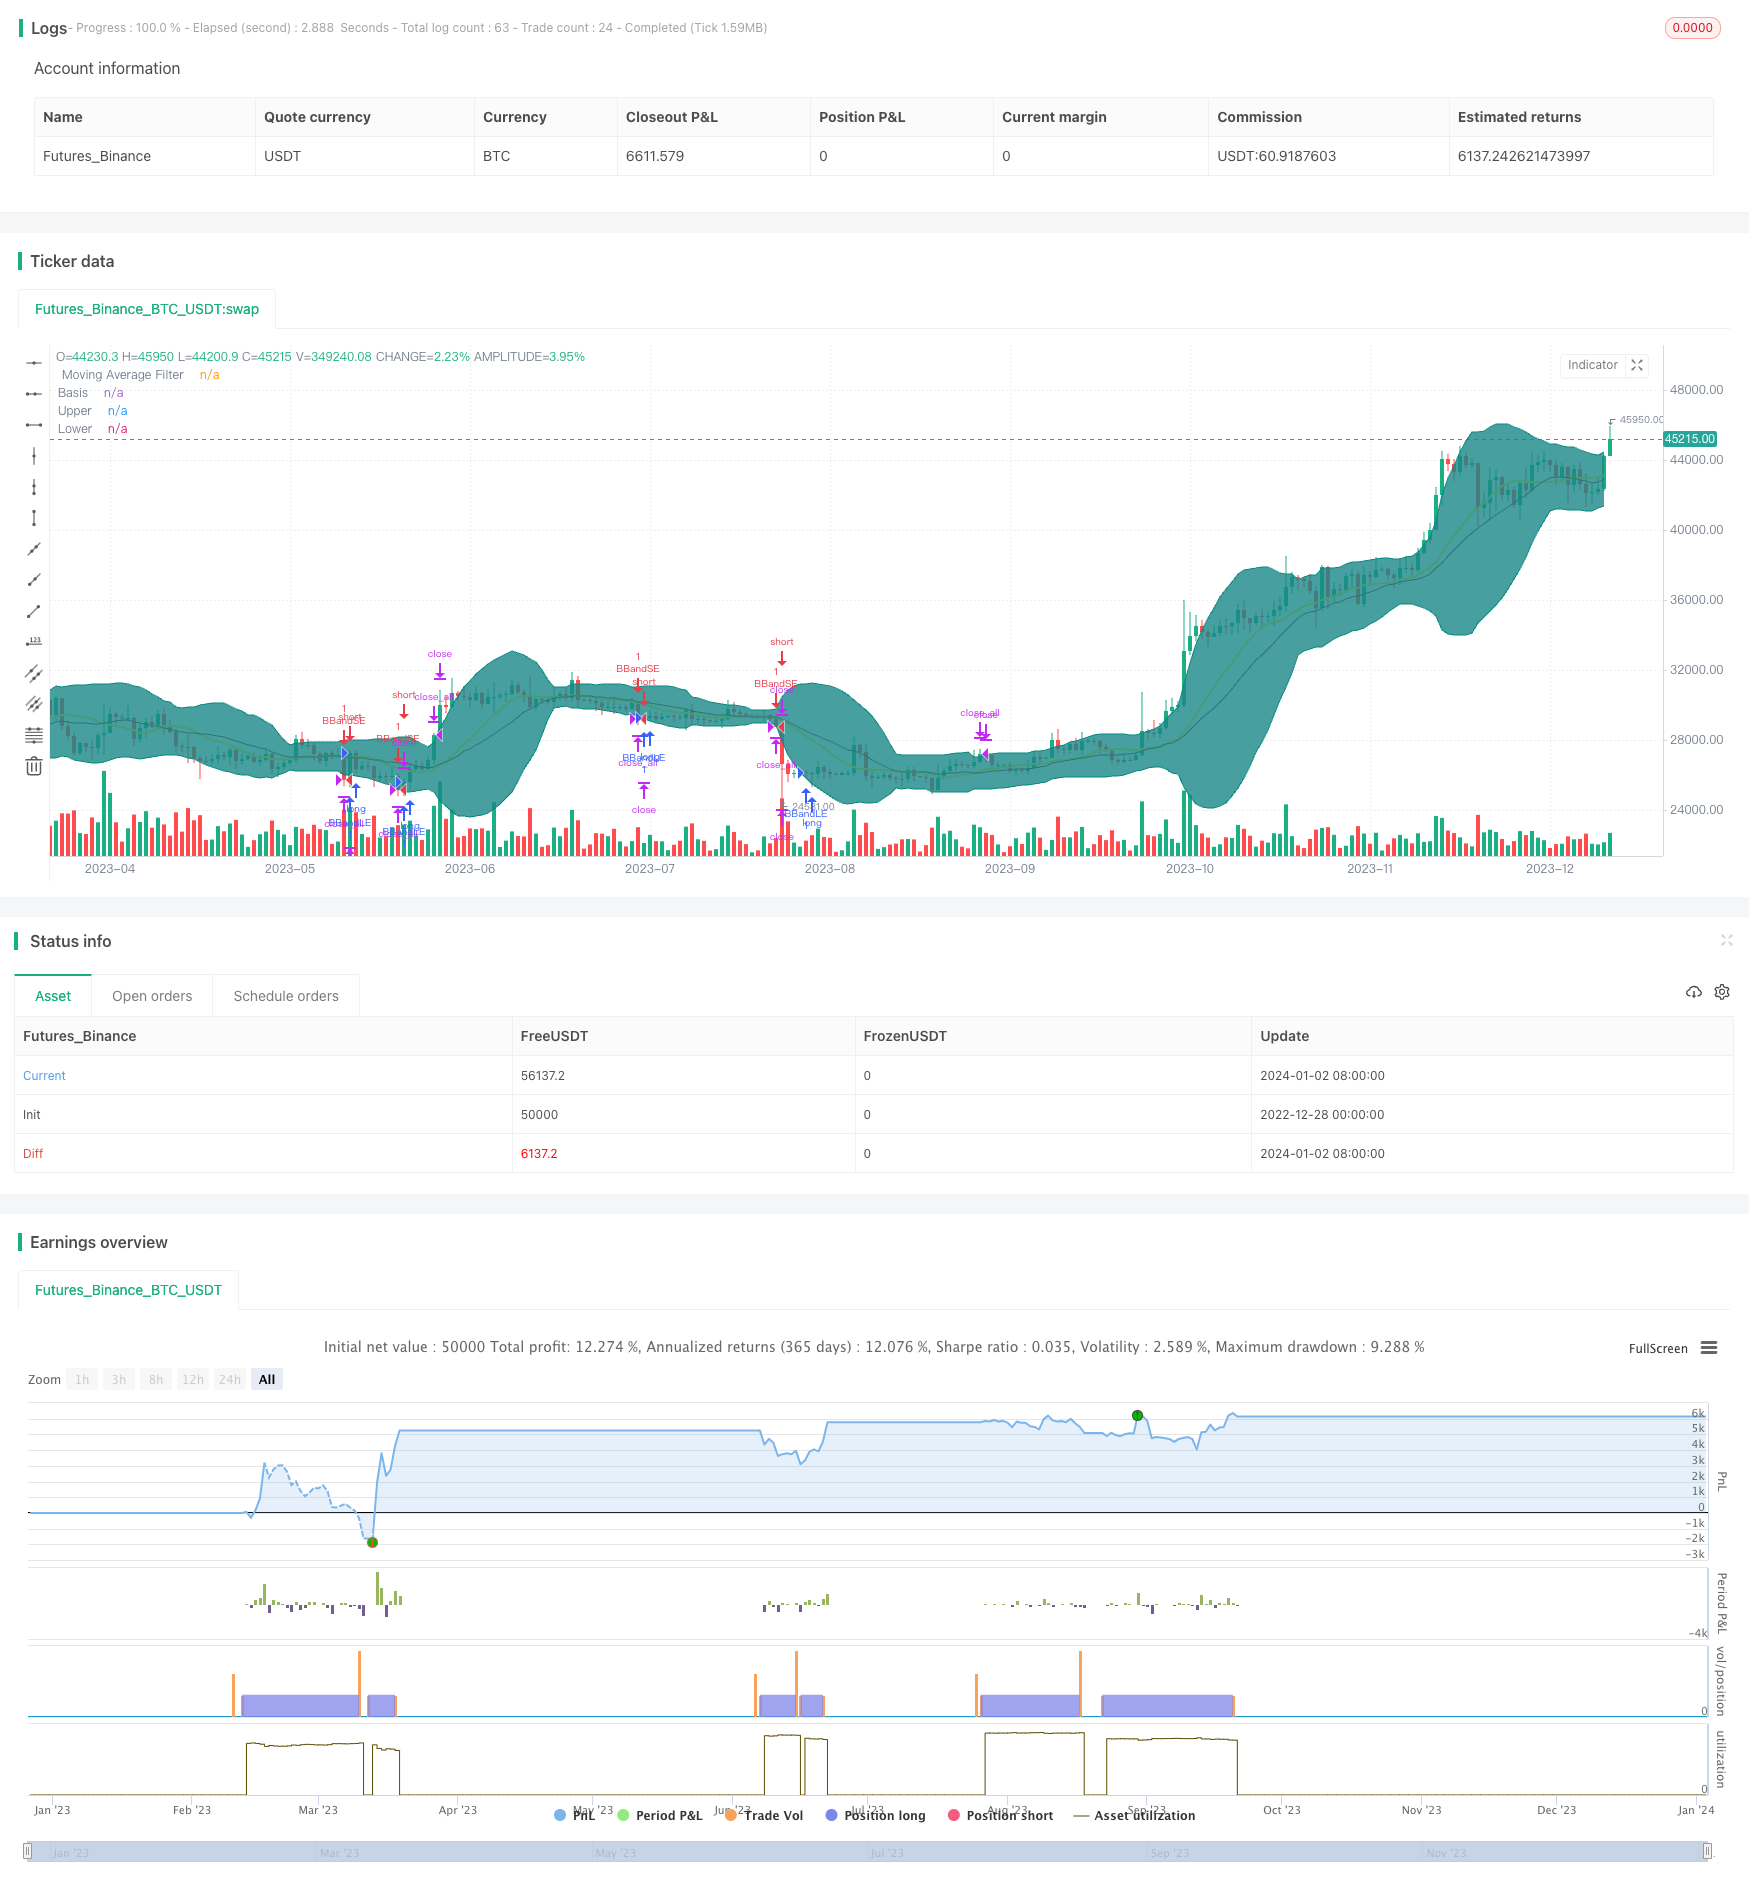
/*backtest
start: 2022-12-28 00:00:00
end: 2024-01-03 00:00:00
period: 1d
basePeriod: 1h
exchanges: [{"eid":"Futures_Binance","currency":"BTC_USDT"}]
*/

//@version=4
//
strategy("Advanced Bollinger Bands Strategy", overlay=true)
//BB Values
wall1= input(defval=true,title="===BB Values===",type=input.bool)
source = input(defval=close,title="BB Source",type=input.source)
length = input(20,title="BB Length", minval=1)
mult = input(2.0,title="BB Multiplier",minval=0.001, maxval=50)
basis = sma(source, length)
dev = mult * stdev(source, length)
upper = basis + dev
lower = basis - dev
offset = input(0, " BB Offset", type = input.integer, minval = -500, maxval = 500)
plot(basis, "Basis", color=#872323, offset = offset)
p1 = plot(upper, "Upper", color=color.teal, offset = offset)
p2 = plot(lower, "Lower", color=color.teal, offset = offset)
fill(p1, p2, title = "Background", color=#198787, transp=95)
//Moving Average Values
wall2= input(defval=true,title="===MA Values===",type=input.bool)
nfl= input(defval=14,title="Moving Average Period",type=input.integer,minval=1,maxval=100)
source1= input(defval=close,title="Moving Average Source",type=input.source)
noisefilter= sma(source1,nfl)
plot(noisefilter,style=plot.style_line,linewidth=2,color=color.yellow,title=" Moving Average Filter")
bgcolor(noisefilter<lower?color.green:noisefilter>upper?color.red:na,title="Moving Average Filter")
//Strategy Conditions
wall3= input(defval=true,title="===Strategy Conditions===",type=input.bool)
bl= input(defval=false,title="Exit at Basis Line?",type=input.bool)
nflb= input(defval=false,title="Use Moving Average Filter?",type=input.bool)

//Strategy Condition
buyEntry = crossover(source, lower)
sellEntry = crossunder(source, upper)

if (nflb?(crossover(source,lower) and noisefilter<lower): crossover(source, lower))
	strategy.entry("BBandLE", strategy.long, oca_name="BollingerBands",  comment="BBandLE")

else
	strategy.cancel(id="BBandLE")
if (nflb?(crossunder(source,lower) and noisefilter>upper): crossunder(source, lower))
	strategy.entry("BBandSE", strategy.short, oca_name="BollingerBands",  comment="BBandSE")
else
	strategy.cancel(id="BBandSE")

strategy.close_all(when=bl?crossover(source,basis) or crossunder(source,basis):crossover(source,upper) or crossunder(source,lower))