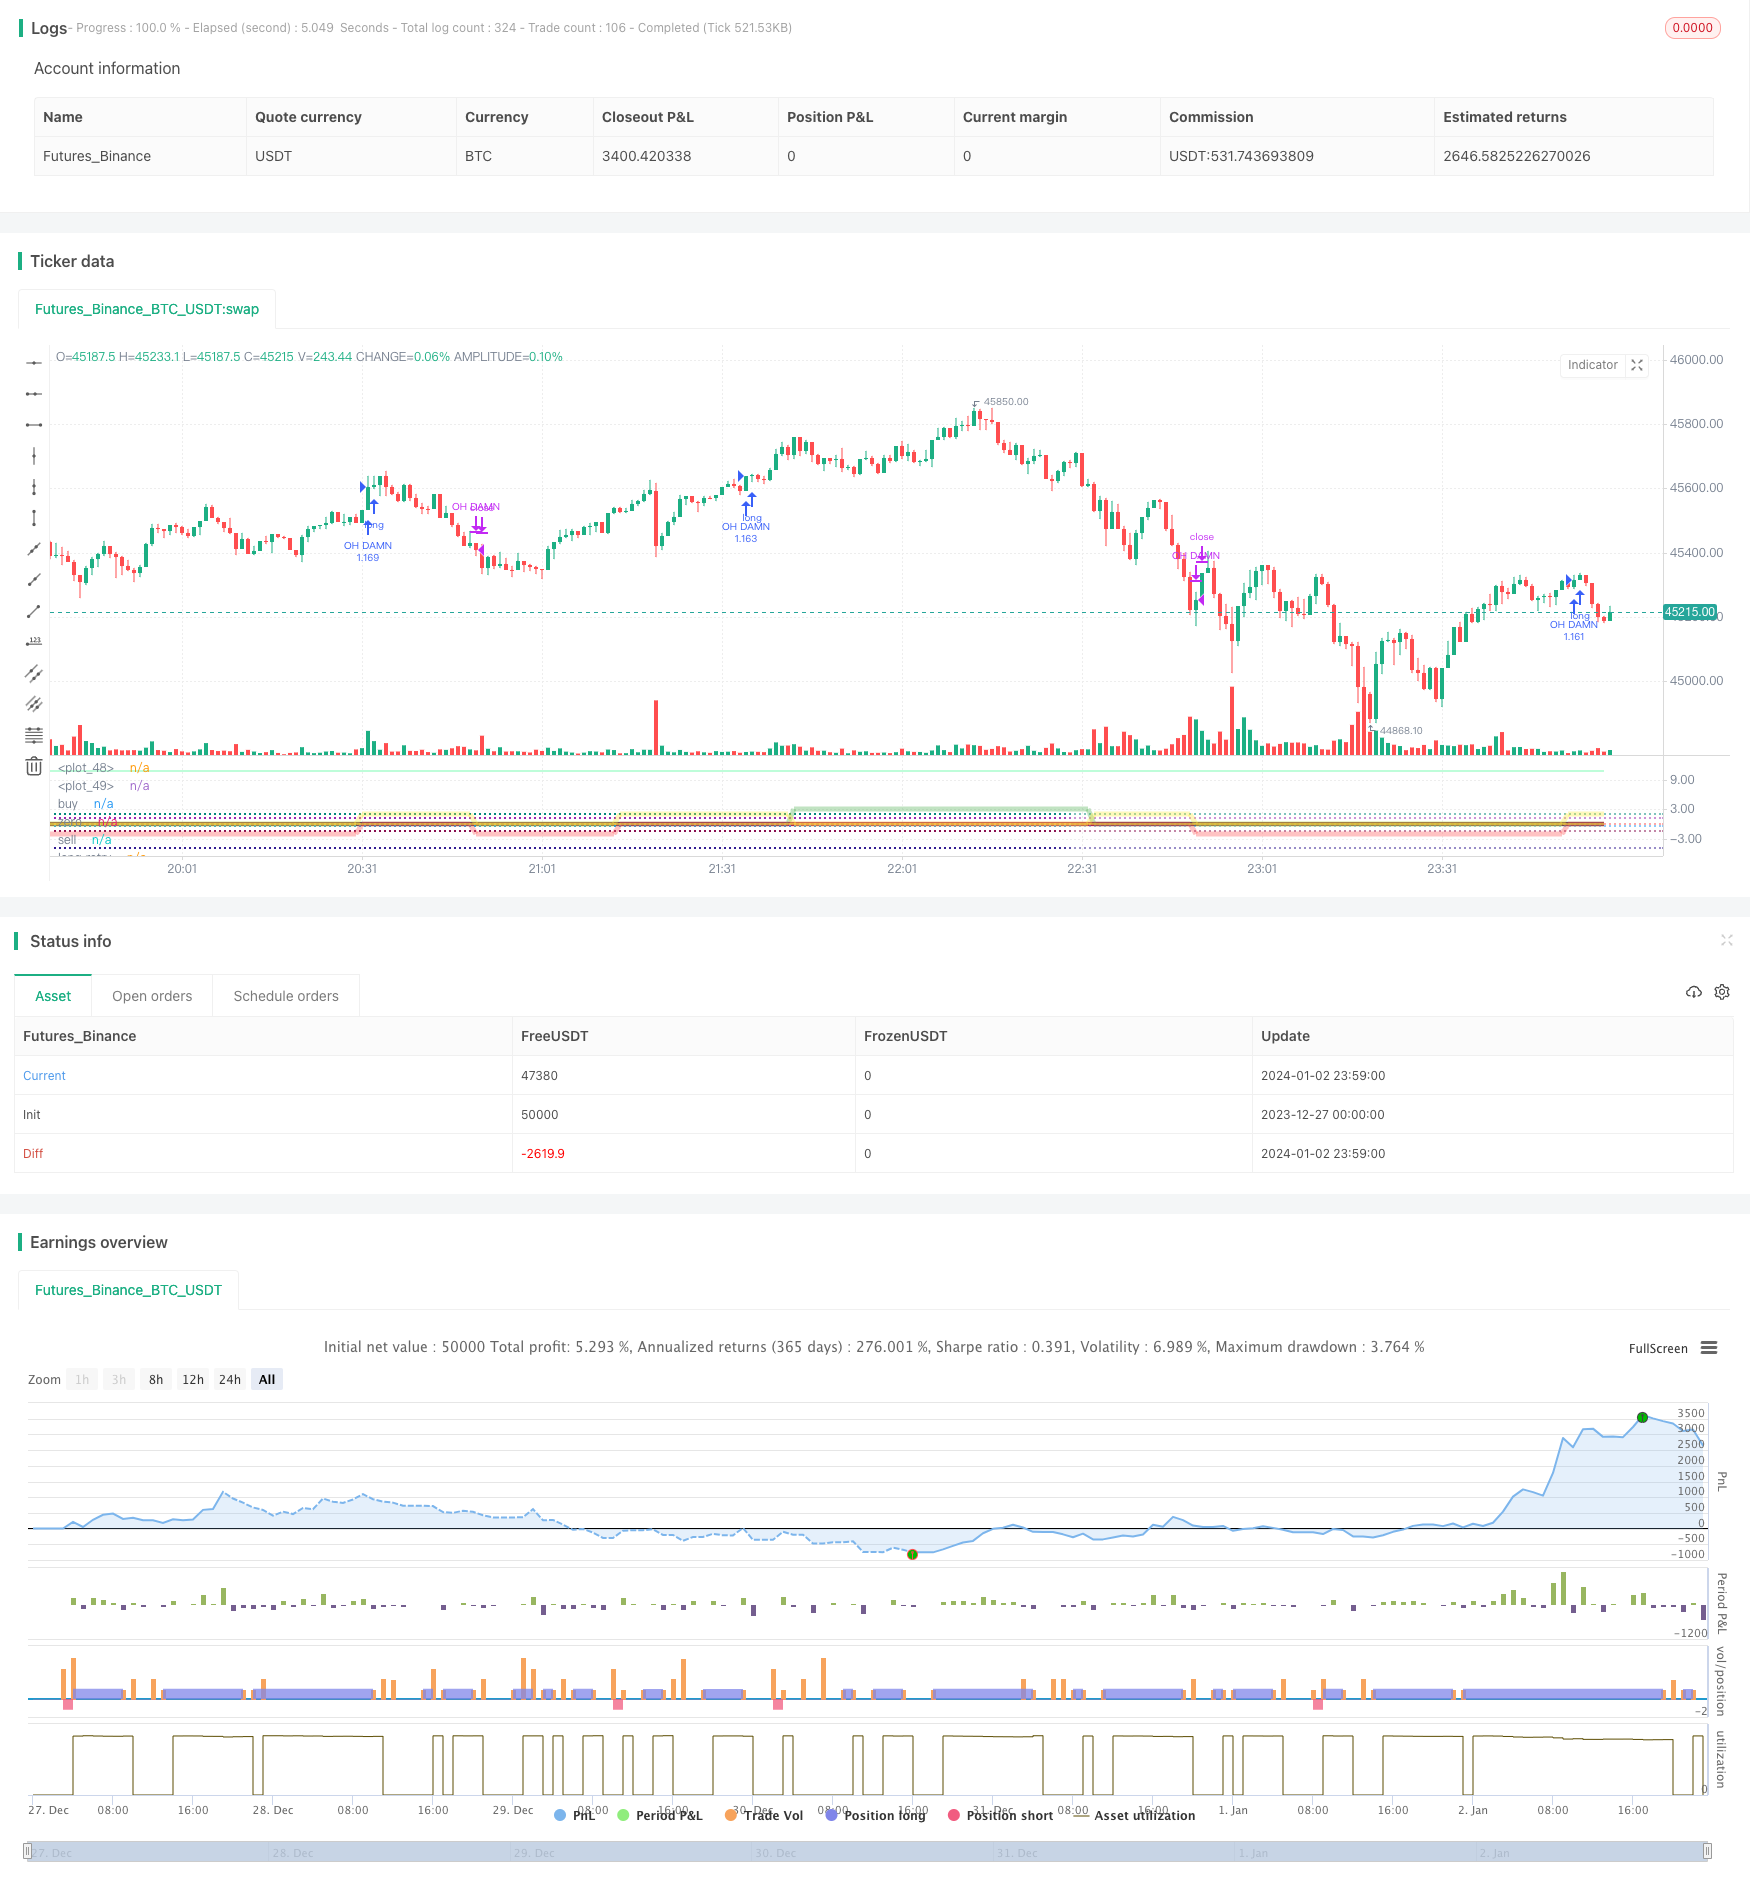
概述(Overview)
该策略基于布温科指标开发自动识别市场趋势并建立多空头寸。它集成了布温科指标、移动平均线和水平支撑线等技术指标,可以自动识别突破信号并建立头寸。
策略原理(Strategy Principle)
该策略的核心指标是布温科指标,它通过计算不同交易日收盘价的对数差值,判断市场趋势和重要支撑/阻力位。当指标上穿某一水平线时做多,下穿时做空。
此外,该策略集成了21日、55日等多根移动平均线组成的“EMA防护带”。根据这些均线的排序关系判断目前是多头市场、空头市场还是盘整市场,并相应限制做空或者做多操作。
通过布温科指标识别交易信号,移动平均线判断市场阶段,两者结合使用,可以避免不适当的头寸建立。
优势分析(Advantage Analysis)
该策略最大的优势是可以自动识别市场的多空趋势,布温科指标对两个时间段价格的差值非常敏感,可以快速定位关键支撑阻力;与此同时,移动平均线的排序又可以有效判断目前所处的行情,是看多还是看空。
这种结合快速指标与趋势指标的思路,使得策略可以快速定位买卖点,同时防止不适当的买卖。这就是该策略的最大优势。
风险分析(Risk Analysis)
该策略的风险主要来自两个方面,一是布温科指标本身对价格变动非常敏感,可能会产生许多不必要的交易信号;二是移动平均线在横盘时会排序混乱,导致头寸建立混乱。
针对第一点风险,可以适当调整布温科指标参数,增加指标计算周期,减少不必要交易;针对第二点风险,可以增加更多移动平均线,使得判断趋势更加准确。
优化方向(Optimization Directions)
该策略的主要优化方向是参数调整与过滤条件增加。
针对布温科指标,可以尝试不同周期参数,找到最佳参数组合;针对移动平均线,可以继续加入更多均线,形成更完整的趋势判断体系。此外还可以加入波动率指标、交易量指标等过滤条件,降低虚假信号。
通过参数与条件的综合调整,可以进一步提升策略的稳定性与盈利能力。
总结(Summary)
该自适应布温科多空策略成功结合了快速指标与趋势指标,可以自动识别市场关键点并建立正确头寸。它的优点是快速定位与防止不适当头寸建立的能力。下一步可以通过参数与条件优化,进一步提升策略稳定性与盈利水平。
/*backtest
start: 2023-12-27 00:00:00
end: 2024-01-03 00:00:00
period: 1m
basePeriod: 1m
exchanges: [{"eid":"Futures_Binance","currency":"BTC_USDT"}]
*/

// This source code is subject to the terms of the Mozilla Public License 2.0 at https://mozilla.org/MPL/2.0/
// © boftei

//@version=5

strategy("Boftei's Strategy", overlay=false, pyramiding=1, default_qty_type= strategy.percent_of_equity, default_qty_value = 100, calc_on_order_fills=false, margin_long = 100, margin_short = 100, slippage=0, commission_type=strategy.commission.percent, commission_value = 0, initial_capital = 40, precision = 6)
strat_dir_input = input.string("all", "strategy direction", options=["long", "short", "all"])
strat_dir_value = strat_dir_input == "long" ? strategy.direction.long : strat_dir_input == "short" ? strategy.direction.short : strategy.direction.all
strategy.risk.allow_entry_in(strat_dir_value)
//////////////////////////////////////////////////////////////////////
//DATA
testStartYear = input(2005, "Backtest Start Year")
testStartMonth = input(7, "Backtest Start Month")
testStartDay = input(16, "Backtest Start Day")
testPeriodStart = timestamp(testStartYear,testStartMonth,testStartDay,0,0)
//Stop date if you want to use a specific range of dates
testStopYear = input(2030, "Backtest Stop Year")
testStopMonth = input(12, "Backtest Stop Month")
testStopDay = input(30, "Backtest Stop Day")
testPeriodStop = timestamp(testStopYear,testStopMonth,testStopDay,0,0)


testPeriod() =>
    time >= testPeriodStart and time <= testPeriodStop ? true : false
//////////////////////////////////////////////////////////////////////
sell = input.float(0.0065, "sell level")
buy = input.float(0, "buy level")
long1 = input.float(-0.493, "long retry - too low")
long2 = input.float(2, "long close up")
long3 = input.float(-1.5, "long close down")
short1 = input.float(1.26, "short retry - too high")
short2 = input.float(-5, "dead - close the short")
///< botvenko script
nn = input(60, "Histogram Period")
float x = 0
float z = 0
float k = 0


y = math.log(close[0]) - math.log(close[nn])
if y>0
    x := y
else
    k := y
//---------------------------------------------

plot(y > 0 ? x: 0, color = color.green, linewidth = 4)
plot(y <= 0 ? k: 0, color = color.maroon, linewidth = 4)
plot(y, color = color.yellow, linewidth = 1)

co = ta.crossover(y, buy)
cu = ta.crossunder(y, sell)
retry_long = ta.crossunder(y, long1)
deadline_long_up = ta.crossover(y, long2)
deadline_long_down = ta.crossunder(y, long3)
retry_short = ta.crossover(y, short1)
deadline_short = ta.crossunder(y, short2)


hline(buy, title='buy', color=color.green, linestyle=hline.style_dotted, linewidth=2)
hline(0, title='zero', color=color.white, linestyle=hline.style_dotted, linewidth=1)
hline(sell, title='sell', color=color.red, linestyle=hline.style_dotted, linewidth=2)
hline(long1, title='long retry', color=color.blue, linestyle=hline.style_dotted, linewidth=2)
hline(long2, title='overbought', color=color.teal, linestyle=hline.style_dotted, linewidth=2)
hline(long3, title='oversold', color=color.maroon, linestyle=hline.style_dotted, linewidth=2)
hline(short1, title='short retry', color=color.purple, linestyle=hline.style_dotted, linewidth=2)
hline(short2, title='too low to short - an asset may die', color=color.navy, linestyle=hline.style_dotted, linewidth=2)


////////////////////////////////////////////////////////////EMAprotectionBLOCK
ema_21 = ta.ema(close, 21)
ema_55 = ta.ema(close, 55)
ema_89 = ta.ema(close, 89)
ema_144 = ta.ema(close, 144)
//ema_233 = ta.ema(close, 233)
// ema_377 = ta.ema(close, 377)

long_st = ema_21>ema_55 and ema_55>ema_89 and ema_89>ema_144 //and ema_144>ema_233 and ema_233>ema_377
short_st = ema_21<ema_55 and ema_55<ema_89 and ema_89<ema_144 //and ema_144<ema_233 and ema_233<ema_377

g_v = long_st == true?3:0
r_v = short_st == true?-2:0
y_v = long_st != true and short_st != true?2:0

plot(math.log(ema_21), color = color.new(#ffaf5e, 50))
plot(math.log(ema_55), color = color.new(#b9ff5e, 50))
plot(math.log(ema_89), color = color.new(#5eff81, 50))
plot(math.log(ema_144), color = color.new(#5effe4, 50))
//plot(math.log(ema_233), color = color.new(#5e9fff, 50))
//plot(math.log(ema_377), color = color.new(#af5eff, 50))

plot(long_st == true?3:0, color = color.new(color.green, 65), linewidth = 5)
plot(short_st == true?-2:0, color = color.new(color.red, 65), linewidth = 5)
plot(long_st != true and short_st != true?2:0, color = color.new(color.yellow, 65), linewidth = 5)
////////////////////////////////////////////////////////////EMAprotectionBLOCK


if (co and testPeriod() and (g_v == 3 or y_v == 2))
    strategy.close("OH BRO", comment = "EXIT-SHORT")
    strategy.close("OH DUDE", comment = "EXIT-SHORT")
	strategy.entry("OH DAMN", strategy.long, comment="ENTER-LONG 'co'")
if (retry_long and testPeriod() and (g_v == 3 or y_v == 2))
    strategy.close("OH DAMN", comment = "EXIT-LONG")
    strategy.entry("OH BRUH", strategy.long, comment="ENTER-LONG 'retry_long'")

if (cu and testPeriod() and (r_v == -2 or y_v == 2))
    strategy.close("OH DAMN", comment = "EXIT-LONG")
    strategy.close("OH BRUH", comment = "EXIT-LONG")
	strategy.entry("OH BRO", strategy.short, comment="ENTER-SHORT 'cu'")
if (retry_short and testPeriod() and (r_v == -2 or y_v == 2))
    strategy.close("OH BRO", comment = "EXIT-SHORT")
    strategy.entry("OH DUDE", strategy.short, comment="ENTER-SHORT 'retry_short'")


if (deadline_long_up and testPeriod() or r_v == -2 and testPeriod())
    strategy.close("OH DAMN", comment = "EXIT-LONG 'deadline_long_up'")
if (deadline_long_down and testPeriod())
    strategy.close("OH DAMN", comment = "EXIT-LONG 'deadline_long_down'")
if (deadline_short and testPeriod() or g_v == 3 and testPeriod())
    strategy.close("OH BRO", comment = "EXIT-SHORT 'deadline_short'")
    // (you can use strategy.close_all(comment = "close all entries") here)