概述
该策略通过结合交易量和RSI指标来确定买入时机,采用分批设置止盈目标逐步获利的方式管理头寸。该策略适用于震荡行情,可以有效锁定小幅度涨落震荡中重复出现的买点。
策略原理
该策略使用两个指标来识别买入时机:交易量和RSI。具体逻辑是,当交易量超过最近70天交易量平均值的2.5倍,同时RSI低于30(超卖水平)时,发出买入信号。
一旦买入头寸建立,该策略会设置5个不同的止盈目标(0.4%、0.6%、0.8%、1.0%和1.2%),并按照头寸比例(20%、40%、60%、80%和100%)逐步止盈,直到全部头寸平仓。同时设置5%的止损点。
这样,通过分批设置止盈可以锁定小幅度涨势,避免因等待更大涨幅而错失利润。止损可以控制单笔损失。
优势分析
该策略具有以下优势:
使用双重指标识别买点,避免假突破。交易量放大可以确认底部承压力度,RSI超卖可以判断Addon反弹概率。
采用分批止盈策略,可以最大限度锁定小幅震荡中的获利机会,无需等待大幅上涨也可以获利。
适用于震荡行情,特别是价格在机构unfinished区域反复横跳的市场。这类市场短期难有确定方向,该策略可以频繁获利。
停损点设置得较宽,给予市场足够的决策空间。避免因短期价格调整被五未平仓。
风险分析
该策略的主要风险有:
双重指标确认信号存在误判风险,可能买入假突破点位。可通过参数优化降低风险。
分批止盈可能因持仓量过小错失大涨机会。可通过调整止盈点位和头寸比例优化。
停损幅度较大,单笔亏损可能较大。可降低仓位数管理风险。
适合震荡市场,强势市存在较大方向性风险。需关注大级别市场结构。
较高交易频率导致交易成本增加。优选低手续费交易平台。
优化方向
该策略可以从以下方面进行优化:
优化交易量和RSI参数组合,降低误判率。还可以引入MACD,KDJ等其它指标进行确认。
测试不同止盈幅度和头寸比例,找到最优参数组合。还可以引入动态止盈机制。
优化仓位管理策略,通过风险仓位管理系统减小单笔亏损的概率。
增加趋势判断模块,能够识别趋势转向并及时止损。避免持仓过于passive。
引入算法交易和量化回测系统,快速遍历不同参数,寻找最优参数组合。
借鉴机构级high频交易策略的滑点控制和成本控制模型,降低交易次数同时保证盈利率。
总结
该双重指标反转买点策略,通过交易量放量加RSI超卖判断底部,采用分批息盈的方法锁定震荡行情中的小幅获利。优点是频繁获利,无需等待大幅行情;缺点是容易误判信号和高交易频率。可通过多指标优化确认信号质量,通过风险控制和成本控制提高策略稳定性。该策略适合短期locking小幅度利润。
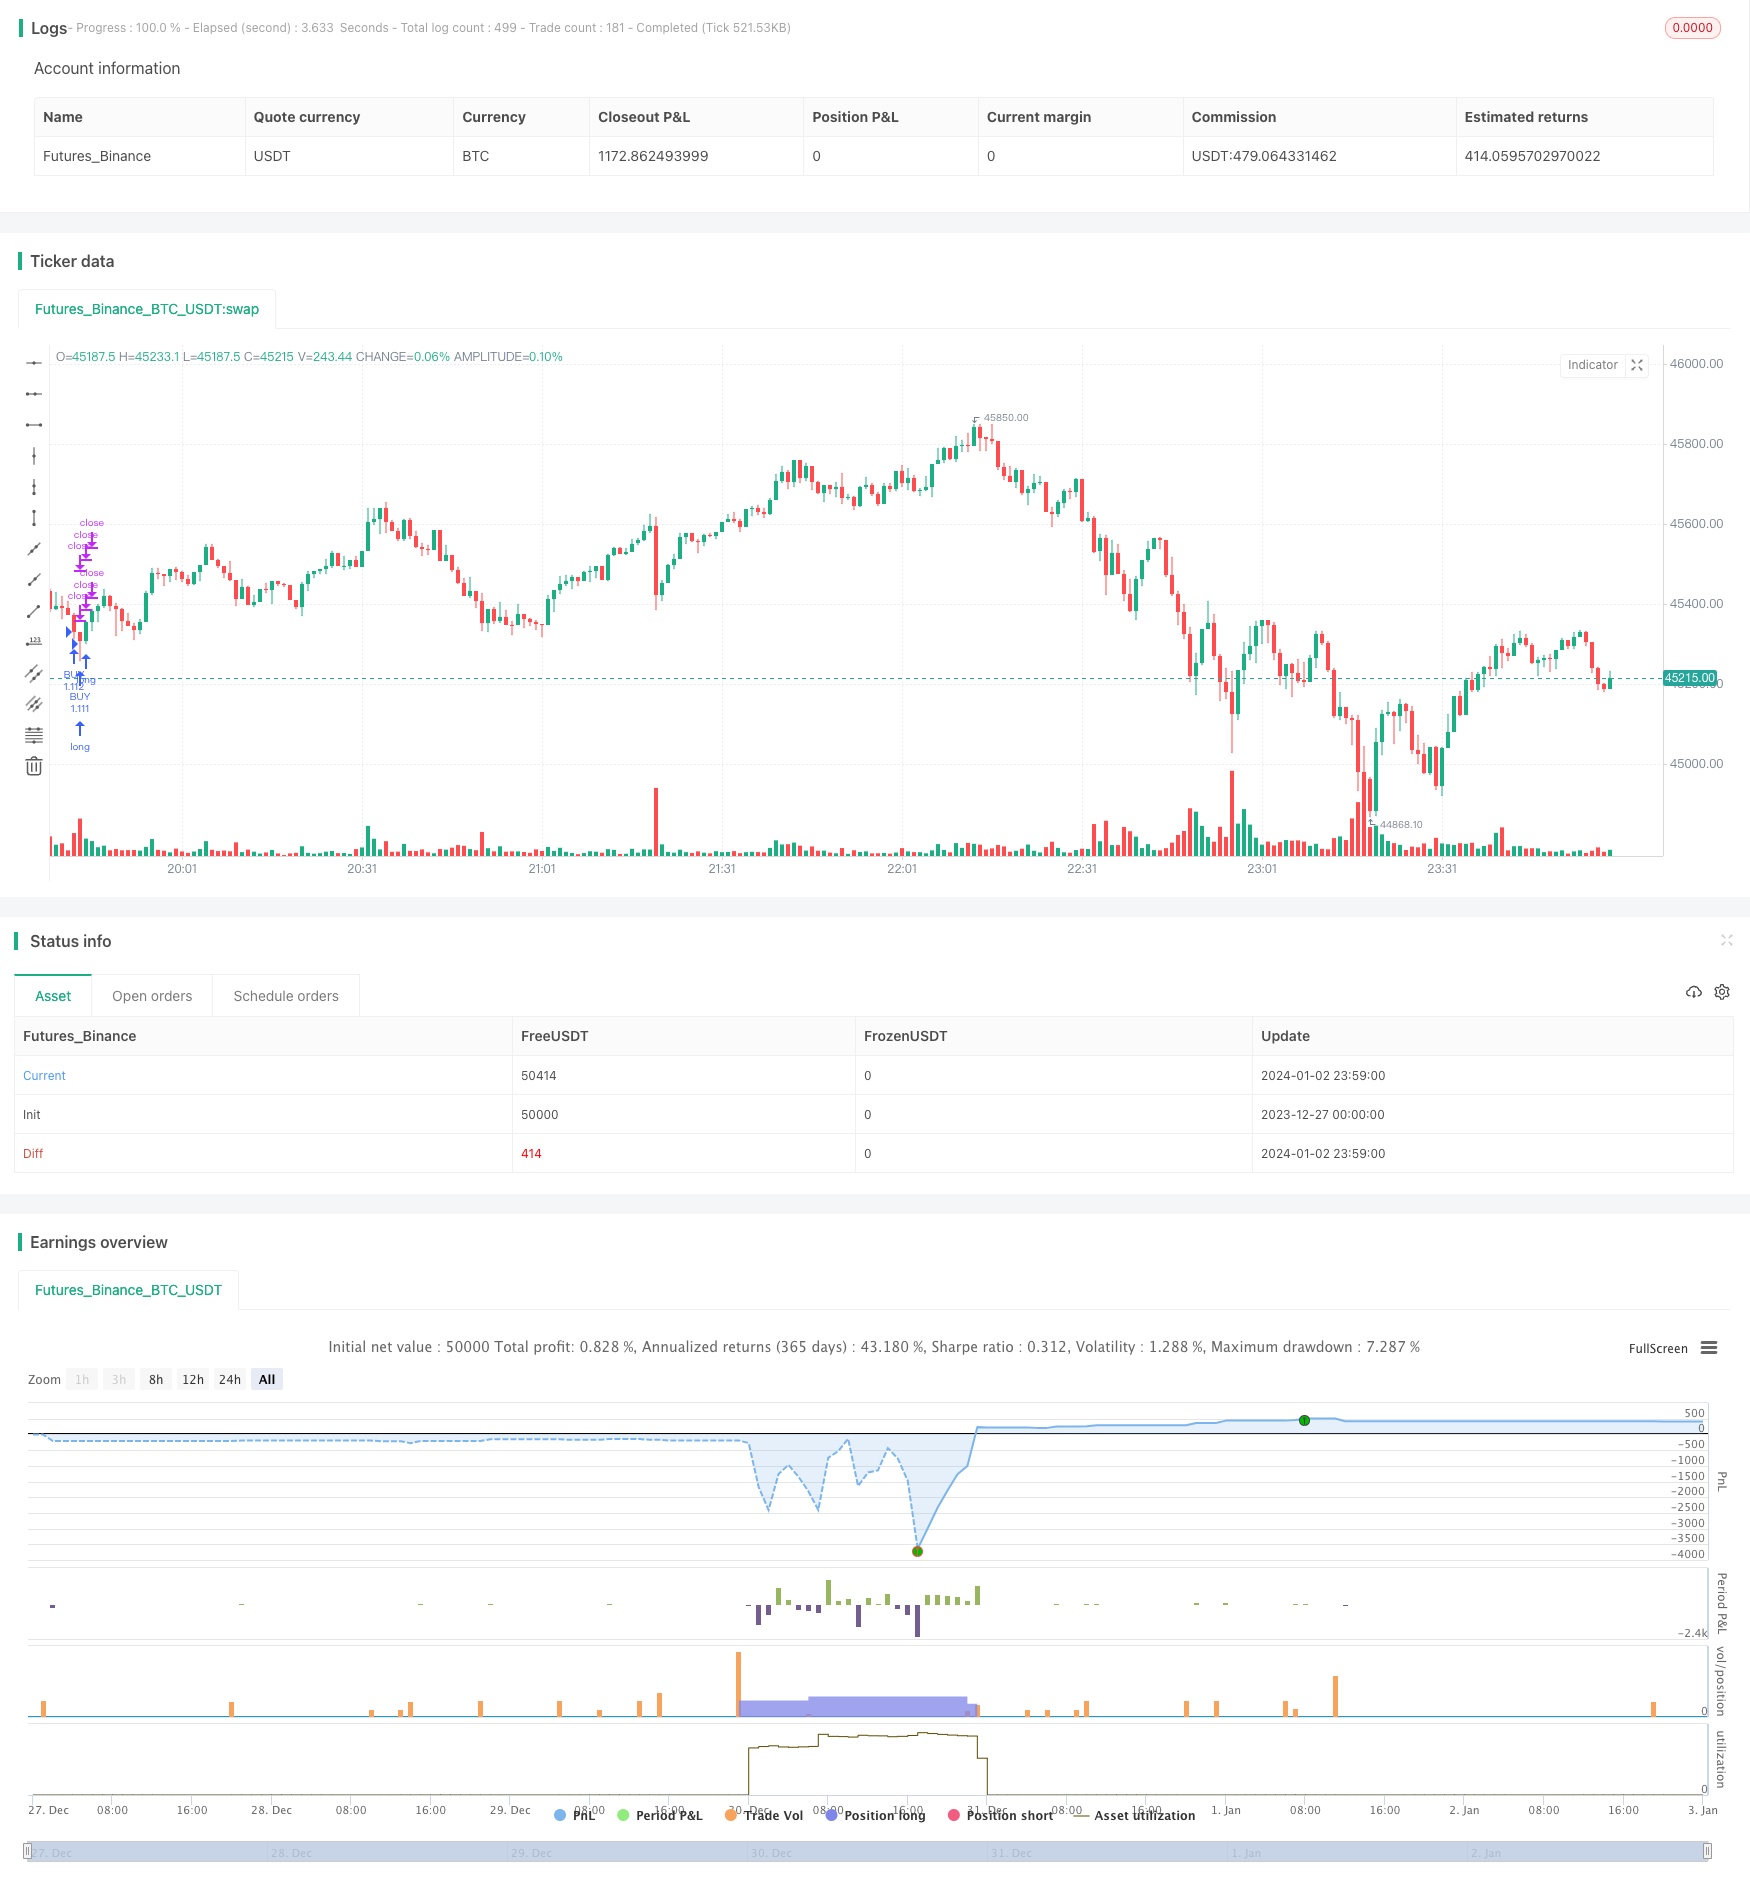
/*backtest
start: 2023-12-27 00:00:00
end: 2024-01-03 00:00:00
period: 1m
basePeriod: 1m
exchanges: [{"eid":"Futures_Binance","currency":"BTC_USDT"}]
*/

// This source code is subject to the terms of the Mozilla Public License 2.0 at https://mozilla.org/MPL/2.0/
// © wielkieef

//@version=5

strategy(title='BTFD strategy [3min]', overlay=true, pyramiding=5, initial_capital=10000, default_qty_type=strategy.percent_of_equity, default_qty_value=100, calc_on_order_fills=false, slippage=0, commission_type=strategy.commission.percent, commission_value=0.03)


// Volume

vol_sma_length = input.int(70, title='Volume lenght  ', minval=1)
Volume_condt = volume > ta.sma(volume, vol_sma_length) * 2.5


// Rsi

rsi_lenght = input.int(20, title='RSI lenght', minval=0)
rsi_up = ta.rma(math.max(ta.change(close), 0), rsi_lenght)
rsi_down = ta.rma(-math.min(ta.change(close), 0), rsi_lenght)
rsi_value = rsi_down == 0 ? 100 : rsi_up == 0 ? 0 : 100 - 100 / (1 + rsi_up / rsi_down)

rsi_overs = rsi_value <= 30
rsi_overb = rsi_value >= 70


// logic

tp_1 = input.float(0.4,"  TP 1", minval=0.1, step=0.1)
tp_2 = input.float(0.6,"  TP 2", minval=0.2, step=0.1)
tp_3 = input.float(0.8,"  TP 3", minval=0.3, step=0.1)
tp_4 = input.float(1.0,"  TP 4", minval=0.4, step=0.1)
tp_5 = input.float(1.2,"  TP 5", minval=0.5, step=0.1)

q_1 = input.int(title='  % TP 1 Q ', defval=20,  minval=1, step=10)
q_2 = input.int(title='  % TP 2 Q ', defval=40,  minval=1, step=10)
q_3 = input.int(title='  % TP 3 Q ', defval=60,  minval=1, step=10)
q_4 = input.int(title='  % TP 4 Q ', defval=80,  minval=1, step=10)
q_5 = input.int(title='  % TP 5 Q ', defval=100, minval=1, step=10)

sl = input.float(5.0, '% Stop Loss', step=0.1)

long_cond = Volume_condt and rsi_overs

// this code is from author RafaelZioni, modified by wielkieef
per(procent) =>
    strategy.position_size != 0 ? math.round(procent / 100 * strategy.position_avg_price / syminfo.mintick) : float(na)
// --------------------------------------------------------------------------------------------------------------------

if  long_cond
    strategy.entry('BUY', strategy.long)

strategy.exit('TP 1', qty_percent=q_1, profit=per(tp_1), loss=per(sl) )
strategy.exit('TP 2', qty_percent=q_2, profit=per(tp_2), loss=per(sl) )
strategy.exit('TP 3', qty_percent=q_3, profit=per(tp_3), loss=per(sl) )
strategy.exit('TP 4', qty_percent=q_4, profit=per(tp_4), loss=per(sl) )
strategy.exit('TP 5', qty_percent=q_5, profit=per(tp_5), loss=per(sl) )


// by wielkieef