概述
该策略通过计算价格的移动平均线以及相对强弱指标RSI来寻找买卖点,在RSI指标处于超买超卖状态时,发出买入和卖出信号,同时使用 Bollinger Bands 来确定价格的支撑和阻力区域,从而过滤掉一些噪音交易信号。
策略原理
该策略主要基于 RSI 指标和多条不同周期的移动平均线的组合使用。具体来说,它计算了1日线到200日线等多条MA,以及 RSI 指标。当价格上穿 200日移動平均线,并且 RSI 指标小于 10 时产生买入信号。当价格下破 5 日移动平均线,并且 1 日线下穿 3 日线时产生卖出信号。
该策略同时使用 Bollinger Bands 来确定价格的支撑和阻力区域。 Bollinger Bands 由中轨、上轨和下轨组成。当价格接近上轨时被视为股票高估区域,当价格接近下轨时被视为股票低估区域。所以 Bollinger Bands 能很好地判断目前股票的相对价值。
优势分析
使用 RSI 指标判断超买超卖区域,这是个经典的计量经济学策略,可以捕捉价格反转机会。
结合多条 MA 平均线,能增强FILTER FILTERING功能,避免被套。
增加 Bollinger Bands 来确定支撑和阻力区域,这能进一步避免在高位追高和在低位追低,过滤噪音交易信号。
风险分析
RSI 指标容易产生误差信号,需要结合价格实体行情判断。
MA 移动平均线常被用来判定趋势,但是价格与 MA 发散时会错误判断趋势转折点。
Bollinger Bands 上下轨支撑阻力确定具有滞后性,不能准确判定 extrema 临时高点和低点。
本策略采取较短持仓时间,可能容易受到短期市场噪音的干扰。
优化方向
可以测试适当延长持仓周期,如将平仓线改为 10 日线或 20 日线。
可以测试调整 RSI 参数,如改为 (3,5) 参数或 (2,8) 参数。
可以尝试增大 Bollinger Bands 参数来获得更加明显的支撑和阻力区间。
可以测试其他指标与 RSI 指标的组合,如 KDJ 指标、MACD 指标等。
可以测试 RSI 与量能指标 OBV 的组合。
总结
该策略整体来说较为经典和稳健,运用了多种不同指标的优势,使买卖信号更加准确可靠,同时也存在一些需要优化的方向。关键是要把握住 RSI 指标的趋势判断功能,以及 Bollinger Bands 对支撑和阻力区域的判断。通过适当参数调整和指标组合优化,该策略可以获得更好的效果。
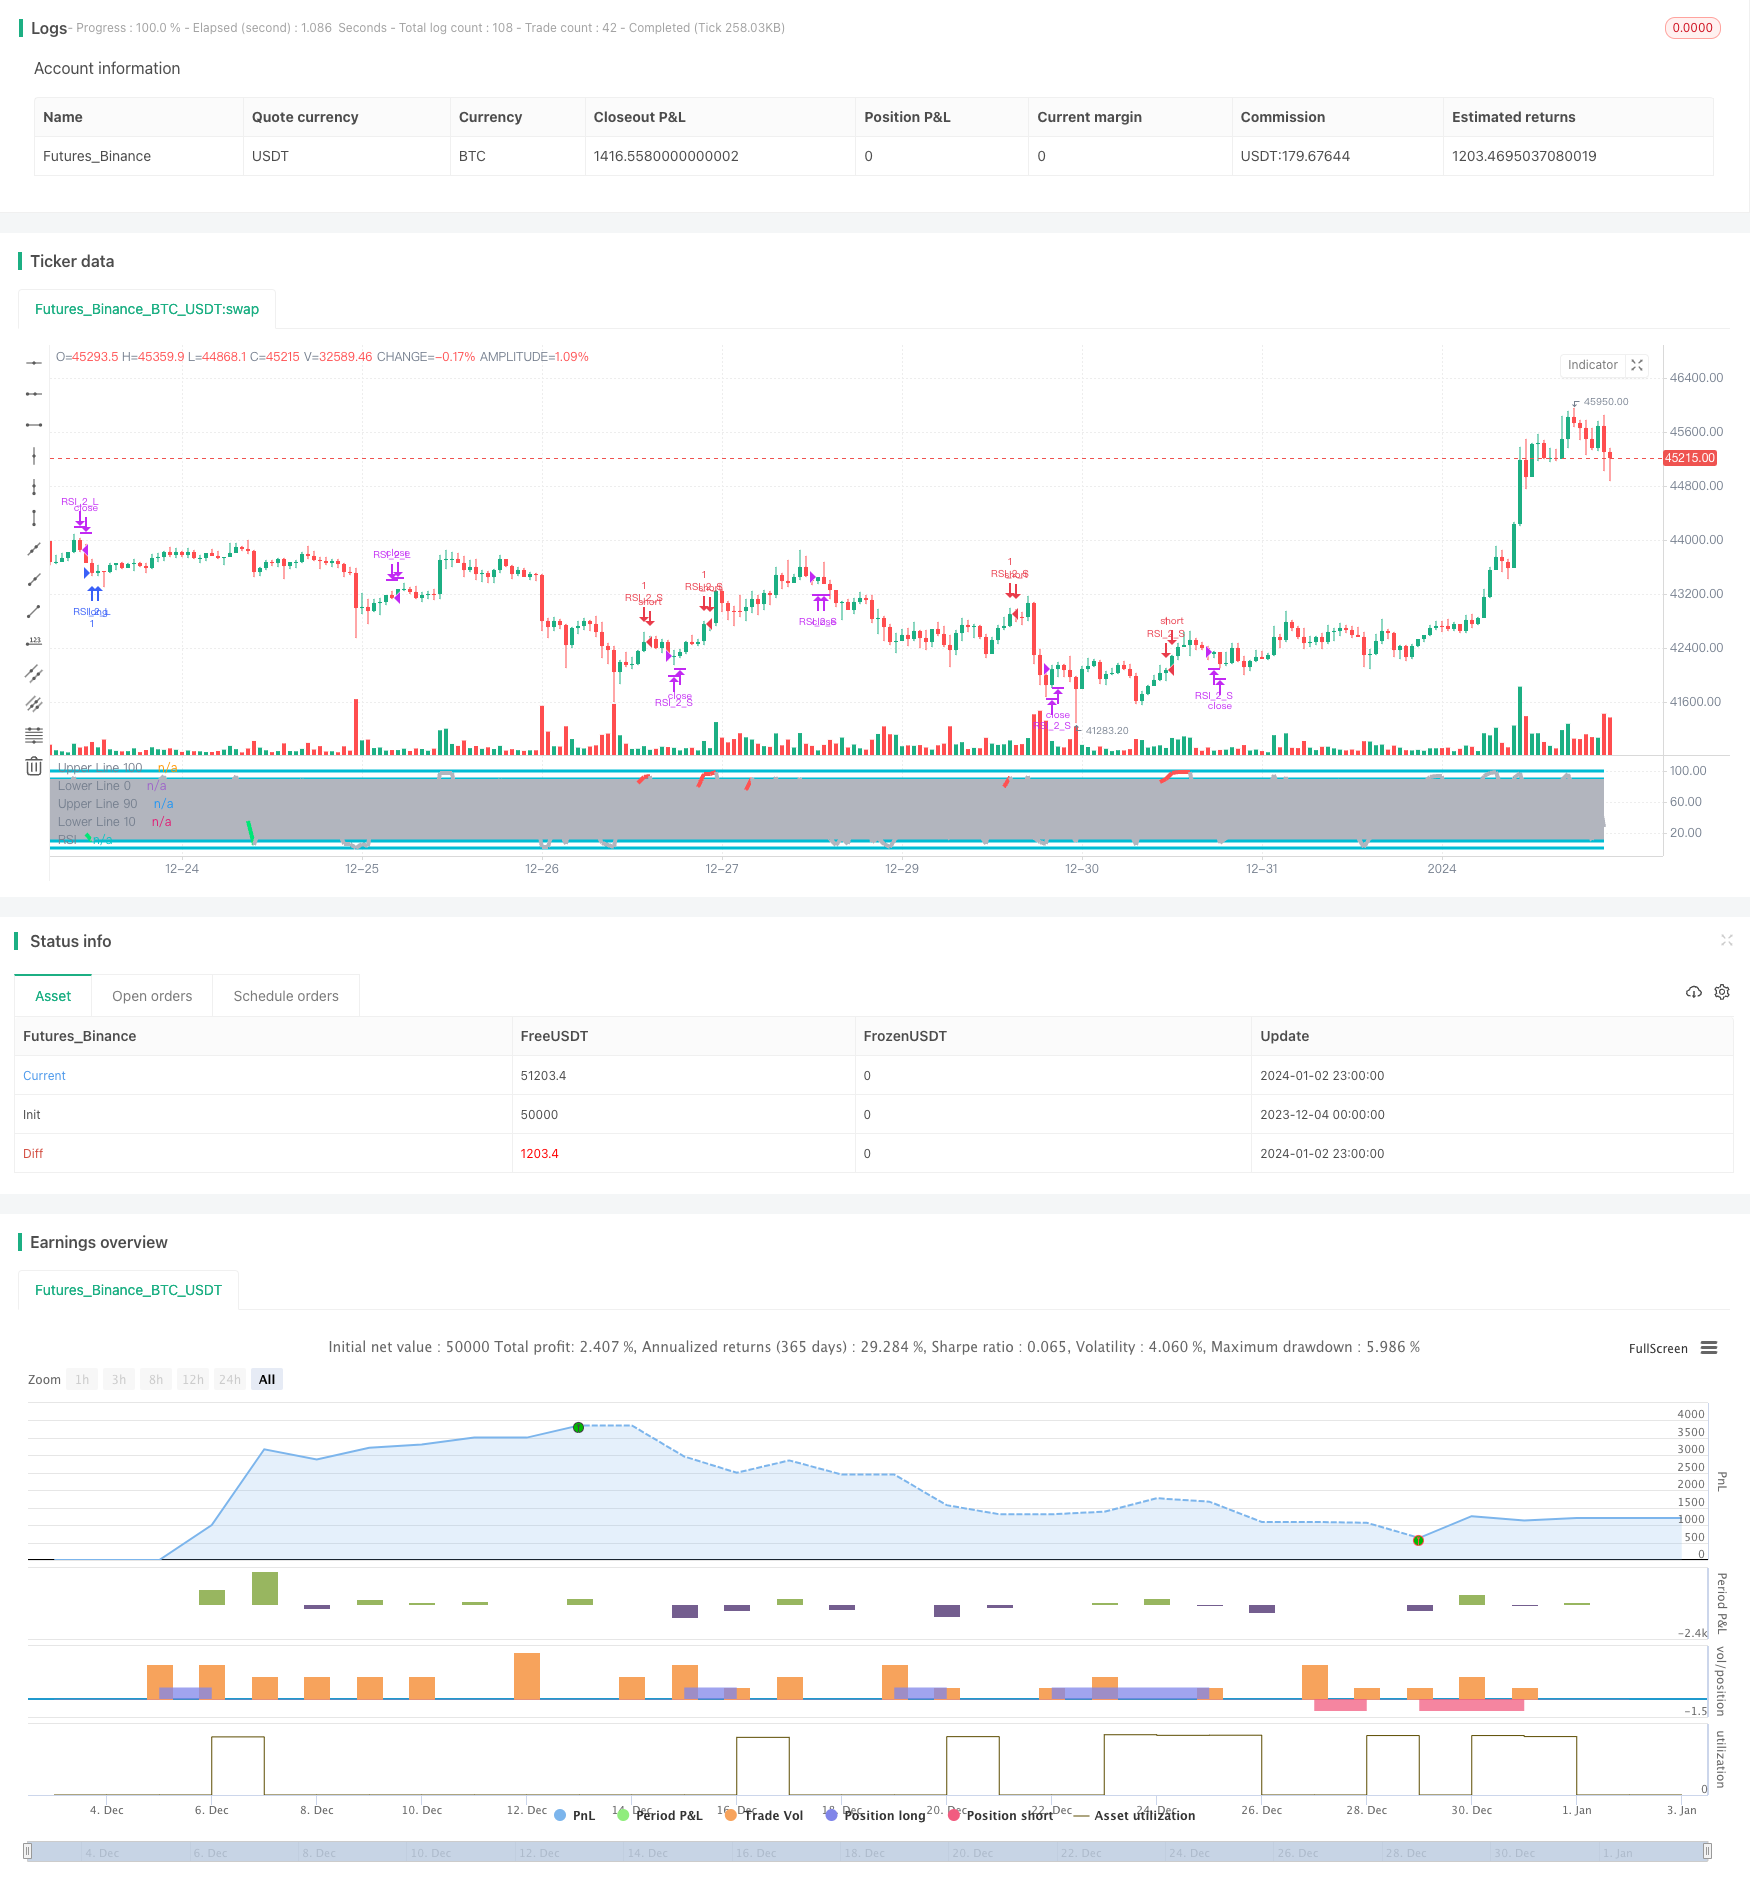
/*backtest
start: 2023-12-04 00:00:00
end: 2024-01-03 00:00:00
period: 1h
basePeriod: 15m
exchanges: [{"eid":"Futures_Binance","currency":"BTC_USDT"}]
*/

//@version=2
//Created by ChrisMoody
//Based on Larry Connors RSI-2 Strategy - Lower RSI
strategy(title="_CM_RSI_2_Strat_Low", shorttitle="_CM_RSI_2_Strategy_Lower", overlay=false)
src = close,

//RSI CODE
up = rma(max(change(src), 0), 2)
down = rma(-min(change(src), 0), 2)
rsi = down == 0 ? 100 : up == 0 ? 0 : 100 - (100 / (1 + up / down))
//Criteria for Moving Avg rules
ma1 = sma(close,1)
ma2 = sma(close,2)
ma3 = sma(close,3)
ma4 = sma(close,4)
ma5 = sma(close,5)
ma6 = sma(close,6)
ma7 = sma(close,7)
ma8 = sma(close,8)
ma9 = sma(close,9)
ma200= sma(close, 120)

//Rule for RSI Color
col = close > ma200 and close < ma5 and rsi < 10 ? lime : close < ma200 and close > ma5 and rsi > 90 ? red : silver

plot(rsi, title="RSI", style=line, linewidth=4,color=col)
plot(100, title="Upper Line 100",style=line, linewidth=3, color=aqua)
plot(0, title="Lower Line 0",style=line, linewidth=3, color=aqua)

band1 = plot(90, title="Upper Line 90",style=line, linewidth=3, color=aqua)
band0 = plot(10, title="Lower Line 10",style=line, linewidth=3, color=aqua)
fill(band1, band0, color=silver, transp=90)

///////////// RSI + Bollinger Bands Strategy


if (close > ma200 and rsi < 10 and rsi >1)
    strategy.entry("RSI_2_L", strategy.long, comment="Bullish")
if (close < ma200 and rsi > 90 and rsi <98)
    strategy.entry("RSI_2_S", strategy.short, comment="Bearish")


strategy.close("RSI_2_L", when = close > ma5 and ma1 < ma3)
strategy.close("RSI_2_S", when = close < ma5 and ma1 > ma2)