本文将详细分析一个基于简单移动平均线的趋势跟随策略。该策略运用多时间框架的均线组合产生交易信号,属于典型的趋势跟随策略。
策略概述
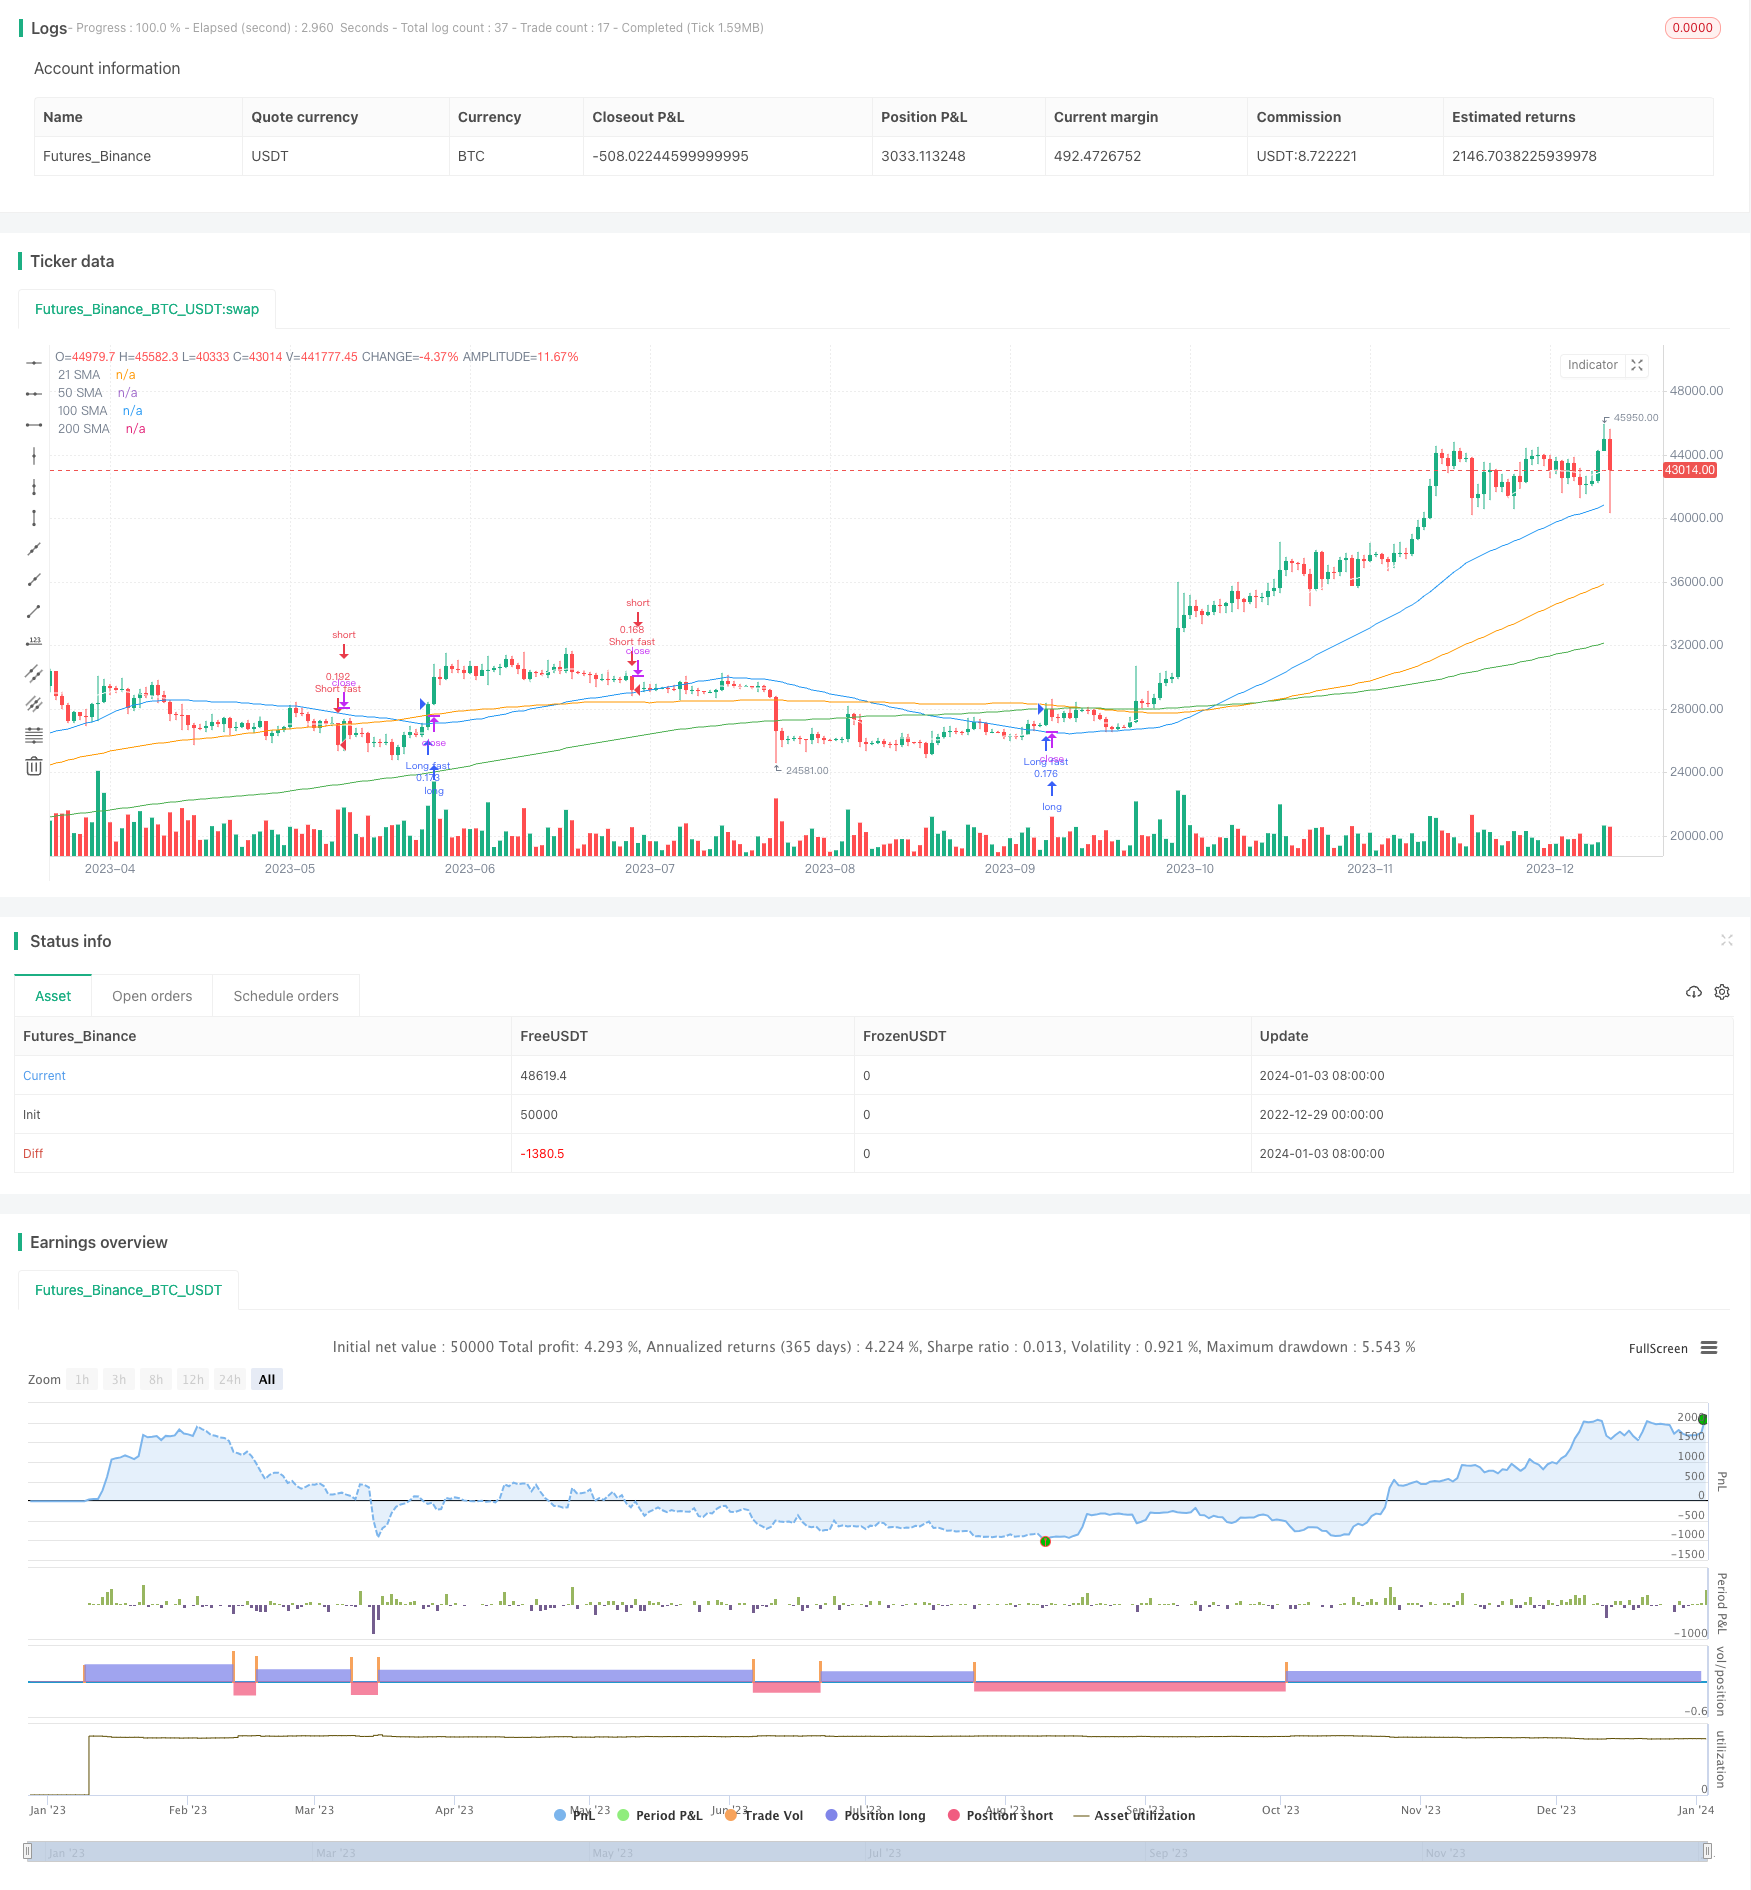
该策略同时使用 21 日、50 日、100 日和 200 日的简单移动平均线。当价格突破这些均线时产生买入和卖出信号。此外,策略还利用Donchian通道,在价格突破 20 日和 55 日的最高价或最低价时补充产生交易信号。该策略适合趋势较明显的市场,通过多个时间框架锁定趋势获利。
策略原理
核心原理是使用多个均线时间框架判断趋势方向。具体来说,策略运用 4 条不同时间长度的简单移动平均线:21 日线、50 日线、100 日线和 200 日线。这些均线的时间跨度从短期到长期不断放大,用于识别不同级别的趋势。
当短期均线上穿长期均线时产生买入信号。这表示市场趋势可能发生转折,进入上升通道。而当短期均线下穿长期均线时,产生卖出信号。这标志着市场趋势可能开始反转,进入下行通道。
此外,策略还利用 Donchian 通道补充交易信号。也就是当价格突破 20 日或 55 日的最高价/最低价时,也会触发买入/卖出信号,锁定趋势利润。
综上,该策略同时结合均线理论和Donchian通道,通过多时间框架判断趋势方向,属于典型的趋势跟随策略。
策略优势
- 多时间框架设计,可以有效捕捉中长线明确趋势
- 同时使用均线和Donchian通道,信号较为可靠
- 实现简单,适合量化交易初学者实践
策略风险
- 虚假突破风险。价格可能出现一段时间的剧烈波动,导致均线或Donchian通道发出错误信号
- 震荡行情下容易止损。该策略更适合明确趋势的市场环境
- 参数优化空间有限。移动平均线和Donchian通道难以进行有效参数调整
对应风险的解决方案:
- 增加过滤条件,避免虚假突破。例如增加交易量条件
- 适当缩短止损幅度,应对震荡行情
- 尝试引入机器学习算法自动优化参数
策略优化方向
- 增加基于交易量的过滤条件,避免在价格剧烈波动中产生错误信号
- 尝试将移动平均线替换为能更好平滑价格的指标,如Kaufman自适应移动平均线
- 应用机器学习算法自动优化策略参数,使之更好适应当前市场情况
- 结合波动率指标判断趋势强弱,避免在震荡行情中被套利
总结
本文详细解析了一个基于多时间框架移动平均线和Donchian通道的简单趋势跟随策略。该策略运用不同长度均线组合判断趋势方向,原理简单清晰,容易实现。与此同时,也分析了策略的优势、可能存在的风险和后续的优化思路。通过深入理解和适当优化,相信该策略可以成为量化交易的有利工具。
策略源码
/*backtest
start: 2022-12-29 00:00:00
end: 2024-01-04 00:00:00
period: 1d
basePeriod: 1h
exchanges: [{"eid":"Futures_Binance","currency":"BTC_USDT"}]
*/

//@version=3
strategy("Trend Following", overlay=true, default_qty_type = strategy.percent_of_equity, default_qty_value = 10)

maxIdLossPcnt = input(1, "Max Intraday Loss(%)", type=float)
entryLong = false
entryShort = false

// strategy.risk.max_intraday_loss(maxIdLossPcnt, strategy.percent_of_equity)

if (close > highest(high[1], 20))
    strategy.entry("Long fast", strategy.long)
    entryLong = true


if (close < lowest(low[1], 20))
    strategy.entry("Short fast", strategy.short)
    entryShort = true

if (close > highest(high[1], 55))
    strategy.entry("Long slow", strategy.long)
    entryLong = true

if (close < lowest(low[1], 55))
    strategy.entry("Short slow", strategy.short)
    entryShort = true

len1 = input(21, minval=1, title="21 SMA")
src1 = input(close, title="21 SMA")
out1 = sma(src1, len1)
plot(out1, title="21 SMA", color= white)

len2 = input(50, minval=1, title="50 SMA")
src2 = input(close, title="50 SMA")
out2 = sma(src2, len2)
plot(out2, title="50 SMA", color= blue)

len3 = input(100, minval=1, title="100 SMA")
src3 = input(close, title="100 SMA")
out3 = sma(src3, len3)
plot(out3, title="100 SMA", color= orange)

len4 = input(200, minval=1, title="200 SMA")
src4 = input(close, title="200 SMA")
out4 = sma(src4, len4)
plot(out4, title="200 SMA", color= green)