概述
本策略综合运用一根曲线、日K线、Hull移动平均线、MACD指标等多个指标,构建长短多空决策机制,实现自动交易。
策略原理
基于Ichimoku云带的转换线和延迟线构建多空交易信号。结合Hull移动平均线判断趋势方向。再利用MACD指标判断长短节奏。日内K线判断突破作为入场信号。
转换线是近9日的中价平均。延迟线是近26日的中价平均。当转换线上穿延迟线时,做多。当转换线下穿延迟线时,做空。
Hull移动平均线通过双平均线交叉来判断趋势,当快线上穿慢线时,判断为上升趋势;反之, dann判断为下降趋势。
MACD取12和26指数移动平均线差值,通过零轴和平均线的金叉死叉来判断多空。
日内K线突破延迟线作为入场时机。
策略优势
- 综合多个指标,准确判断趋势方向。
- 选时精准,避免无谓交易。
- 风险控制到位,止损止盈机制。
策略风险
- 参数设定不当可能导致过于激进入场。
- 多指标组合增加了策略复杂度。
- 短线操作难免出现回撤。
策略优化
- 调整参数组合,适应更多品种和周期。
- 加入机器学习模块,实现参数自适应。
- 优化入场动量指标,提高胜率。
总结
本策略结合Ichimoku云带等多个指标信号,搭建完整的量化决策体系。严格的止损止盈机制控制交易风险。通过参数调整和模型优化,可以适应更多交易品种,具有广阔的应用前景。
策略源码
/*backtest
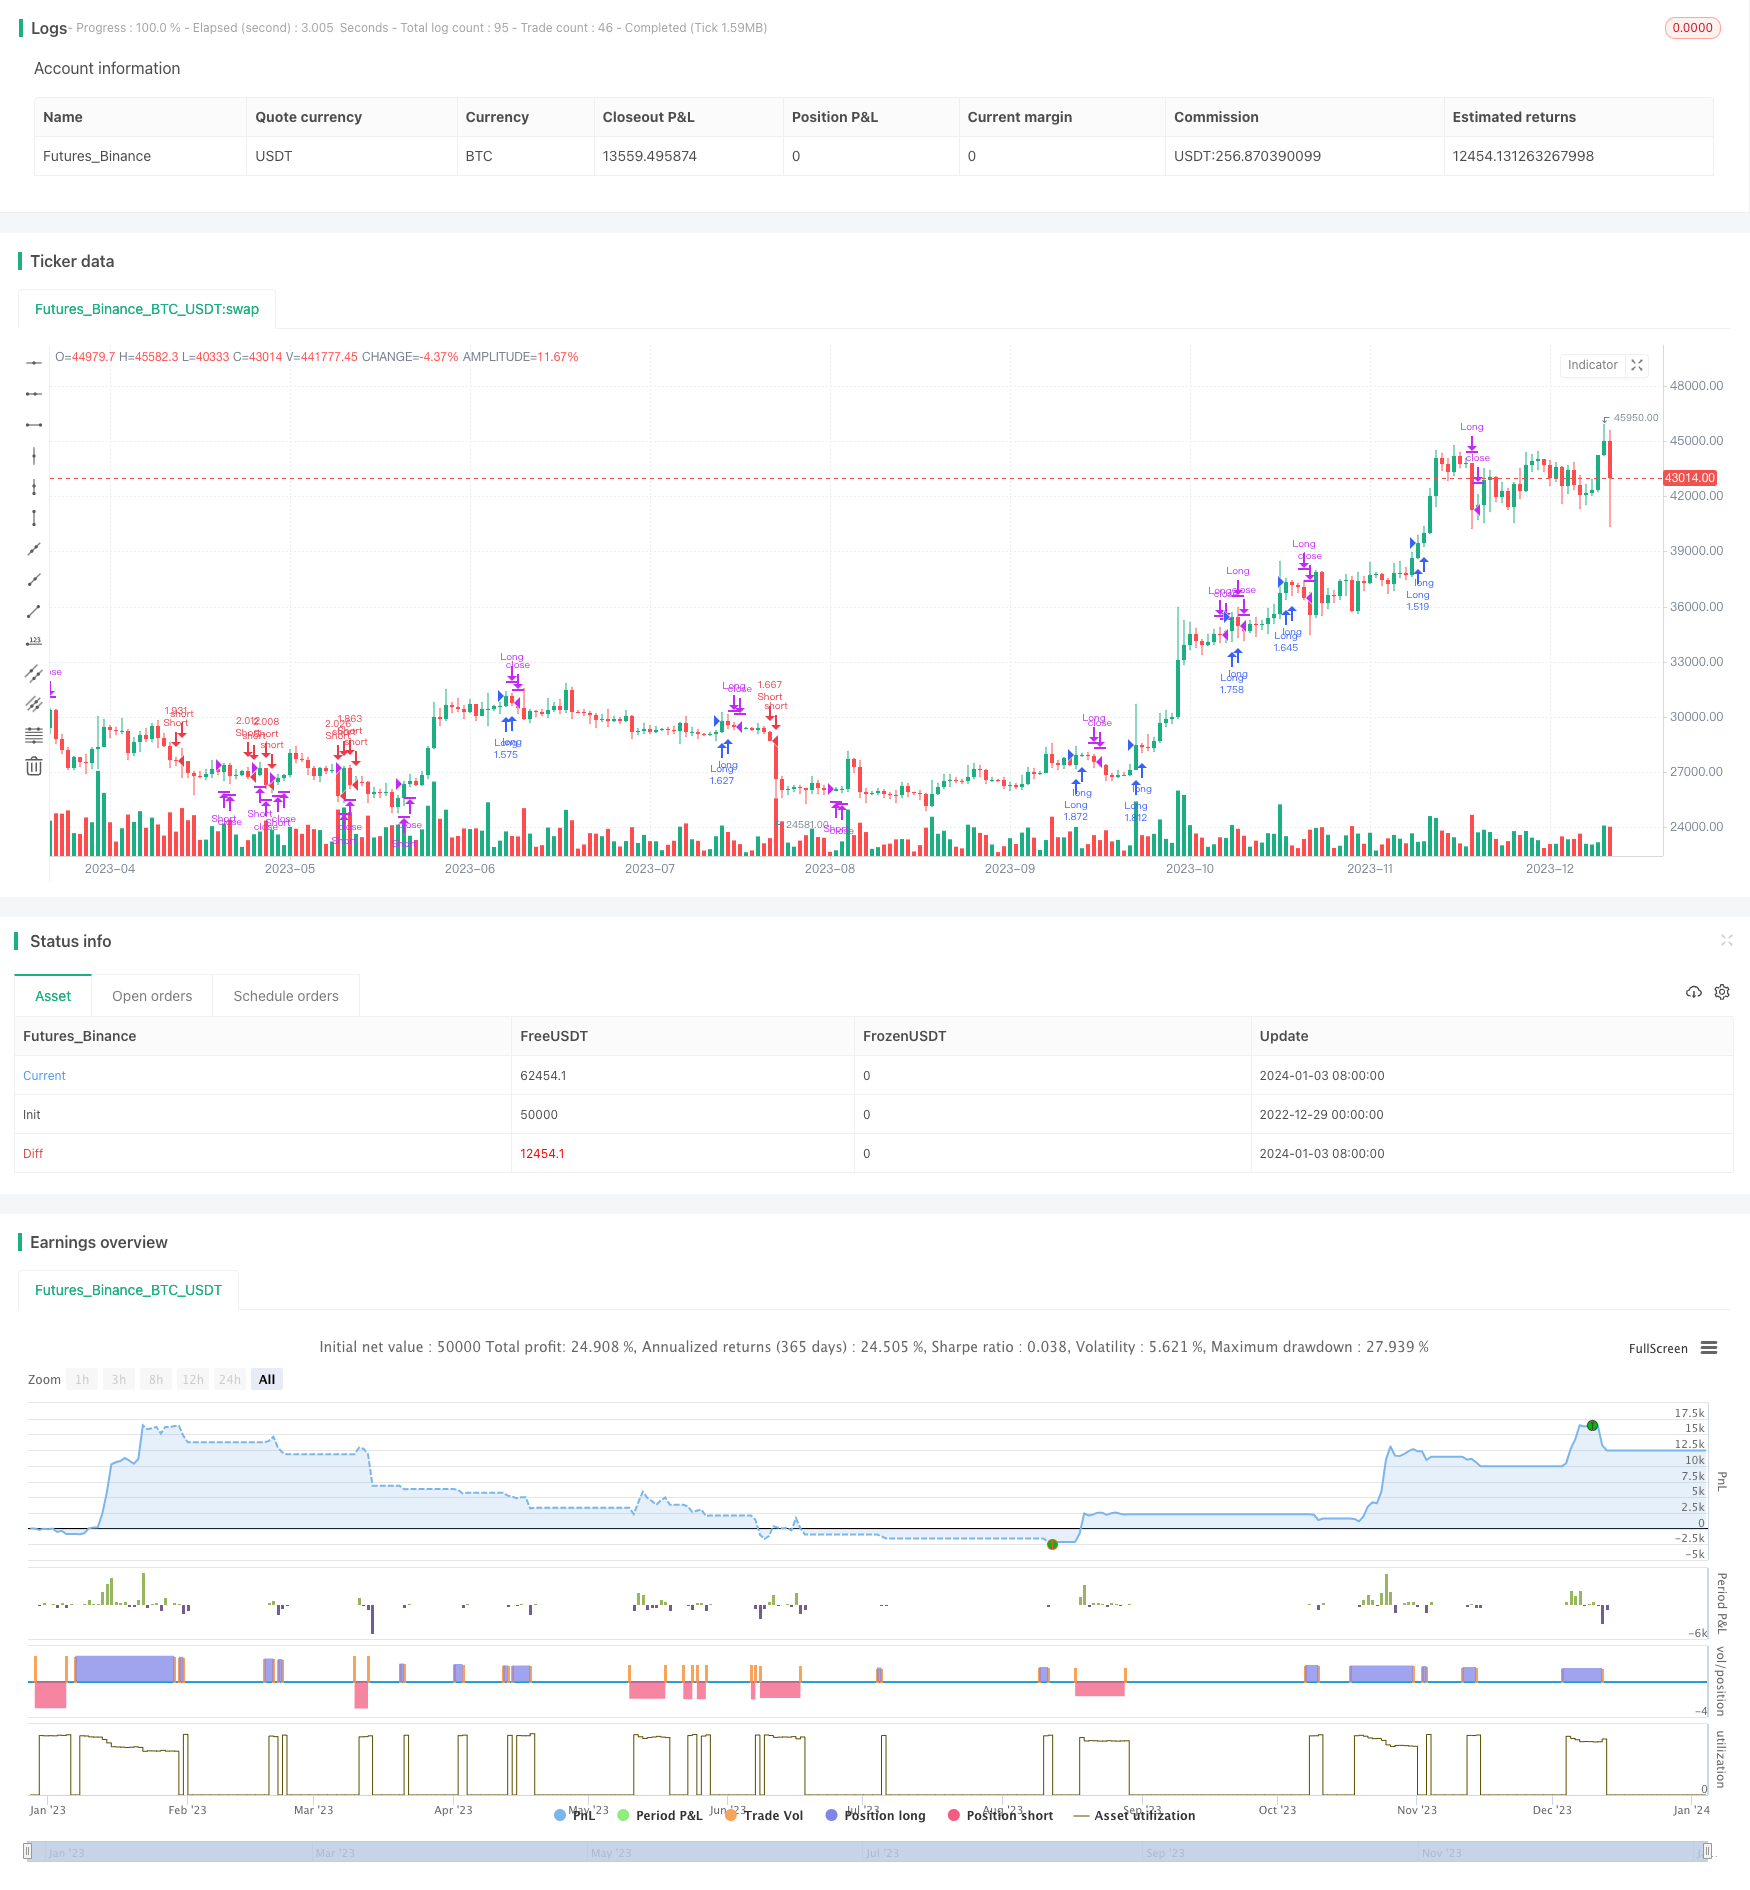
start: 2022-12-29 00:00:00
end: 2024-01-04 00:00:00
period: 1d
basePeriod: 1h
exchanges: [{"eid":"Futures_Binance","currency":"BTC_USDT"}]
*/
//@version=2
// Any timeFrame ok but good on 15 minute & 60 minute , Ichimoku + Daily-Candle_cross(DT) + HULL-MA_cross + MacD combination 420 special blend
strategy("Ichimoku + Daily-Candle_X + HULL-MA_X + MacD", shorttitle="٩(̾●̮̮̃̾•̃̾)۶", overlay=true, default_qty_type=strategy.percent_of_equity, max_bars_back=720, default_qty_value=100, calc_on_order_fills= true, calc_on_every_tick=true, pyramiding=0)
keh=input(title="Double HullMA",defval=14, minval=1)
dt = input(defval=0.0010, title="Decision Threshold (0.001)", type=float, step=0.0001)
SL = input(defval=-500.00, title="Stop Loss in $", type=float, step=1)
TP = input(defval=25000.00, title="Target Point in $", type=float, step=1)
ot=1
n2ma=2*wma(close,round(keh/2))
nma=wma(close,keh)
diff=n2ma-nma
sqn=round(sqrt(keh))
n2ma1=2*wma(close[1],round(keh/2))
nma1=wma(close[1],keh)
diff1=n2ma1-nma1
sqn1=round(sqrt(keh))
n1=wma(diff,sqn)
n2=wma(diff1,sqn)
b=n1>n2?lime:red
c=n1>n2?green:red
d=n1>n2?red:green
confidence=(request.security(syminfo.tickerid, 'D', close)-request.security(syminfo.tickerid, 'D', close[1]))/request.security(syminfo.tickerid, 'D', close[1])
conversionPeriods = input(9, minval=1, title="Conversion Line Periods")
basePeriods = input(26, minval=1, title="Base Line Periods")
laggingSpan2Periods = input(52, minval=1, title="Lagging Span 2 Periods")
displacement = input(26, minval=1, title="Displacement")
donchian(len) => avg(lowest(len), highest(len))
conversionLine = donchian(conversionPeriods)
baseLine = donchian(basePeriods)
leadLine1 = avg(conversionLine, baseLine)
leadLine2 = donchian(laggingSpan2Periods)
LS=close, offset = -displacement
MACD_Length = input(9)
MACD_fastLength = input(12)
MACD_slowLength = input(26)
MACD = ema(close, MACD_fastLength) - ema(close, MACD_slowLength)
aMACD = ema(MACD, MACD_Length)
closelong = n1<n2 and close<n2 and confidence<dt or strategy.openprofit<SL or strategy.openprofit>TP
if (closelong)
strategy.close("Long")
closeshort = n1>n2 and close>n2 and confidence>dt or strategy.openprofit<SL or strategy.openprofit>TP
if (closeshort)
strategy.close("Short")
longCondition = n1>n2 and strategy.opentrades<ot and confidence>dt and close>n2 and leadLine1>leadLine2 and open<LS and MACD>aMACD
if (longCondition)
strategy.entry("Long",strategy.long)
shortCondition = n1<n2 and strategy.opentrades<ot and confidence<dt and close<n2 and leadLine1<leadLine2 and open>LS and MACD<aMACD
if (shortCondition)
strategy.entry("Short",strategy.short)// /L'-,
// ,'-. /MM . . / L '-,
// . _,--dMMMM\ /MMM `.. / '-,
// : _,--, )MMMMMMMMM),. `QMM ,<> /_ '-,'
// ; ___,--. \MM( `-' )M//MM\ ` ,',.; .-'* ; .'
// | \MMMMMM) \MM\ ,dM//MMM/ ___ < ,; `. )`--' /
// | \MM()M MMM)__ /MM(/MP' ___, \ \ ` `. `. /__, ,'
// | MMMM/ MMMMMM( /MMMMP'__, \ | / `. `-,_\ /
// | MM /MMM---' `--'_ \ |-' |/ `./ .\----.___
// | /MM' `--' __,- \"" |-' |_, `.__) . .F. )-.
// | `--' \ \ |-' |_, _,-/ J . . . J-'-. `-.,
// | __ \`. | | | \ / _ |. . . . \ `-. F
// | ___ / \ | `| ' __ \ | /-' F . . . . \ '`
// | \ \ \ / | __ / \ | |,-' __,- J . . . . . \
// | | / |/ __,- \ ) \ / |_,- __,--' |. .__.----,'
// | |/ ___ \ |'. |/ __,--' `.-;;;;;;;;;\
// | ___ \ \ | | ` __,--' /;;;;;;;;;;;;.
// | \ \ |-'\ ' __,--' /;;;;;;;;;;;;;;\
// \ | | / | __,--' `--;;/ \;-'\
// \ | |/ __,--' / / \ \
// \ | __,--' / / \ \
// \|__,--' _,-;M-K, ,;-;\
// <;;;;;;;; '-;;;;
//a1=plot(n1,color=c)
//a2=plot(n2,color=c)
//plot(cross(n1, n2) ? n1 : na, style = circles, color=b, linewidth = 4)
//plot(cross(n1, n2) ? n1 : na, style = line, color=d, linewidth = 4)
//plot(conversionLine, color=#0496ff, title="Conversion Line")
//plot(baseLine, color=#991515, title="Base Line")
//plot(close, offset = -displacement, color=#459915, title="Lagging Span")
//p1=plot (leadLine1, offset = displacement, color=green, title="Lead 1")
//p2=plot (leadLine2, offset = displacement, color=red, title="Lead 2")
//fill(p1, p2, color = leadLine1 > leadLine2 ? green : red)
// remove the "//" from before the plot script if want to see the indicators on chart