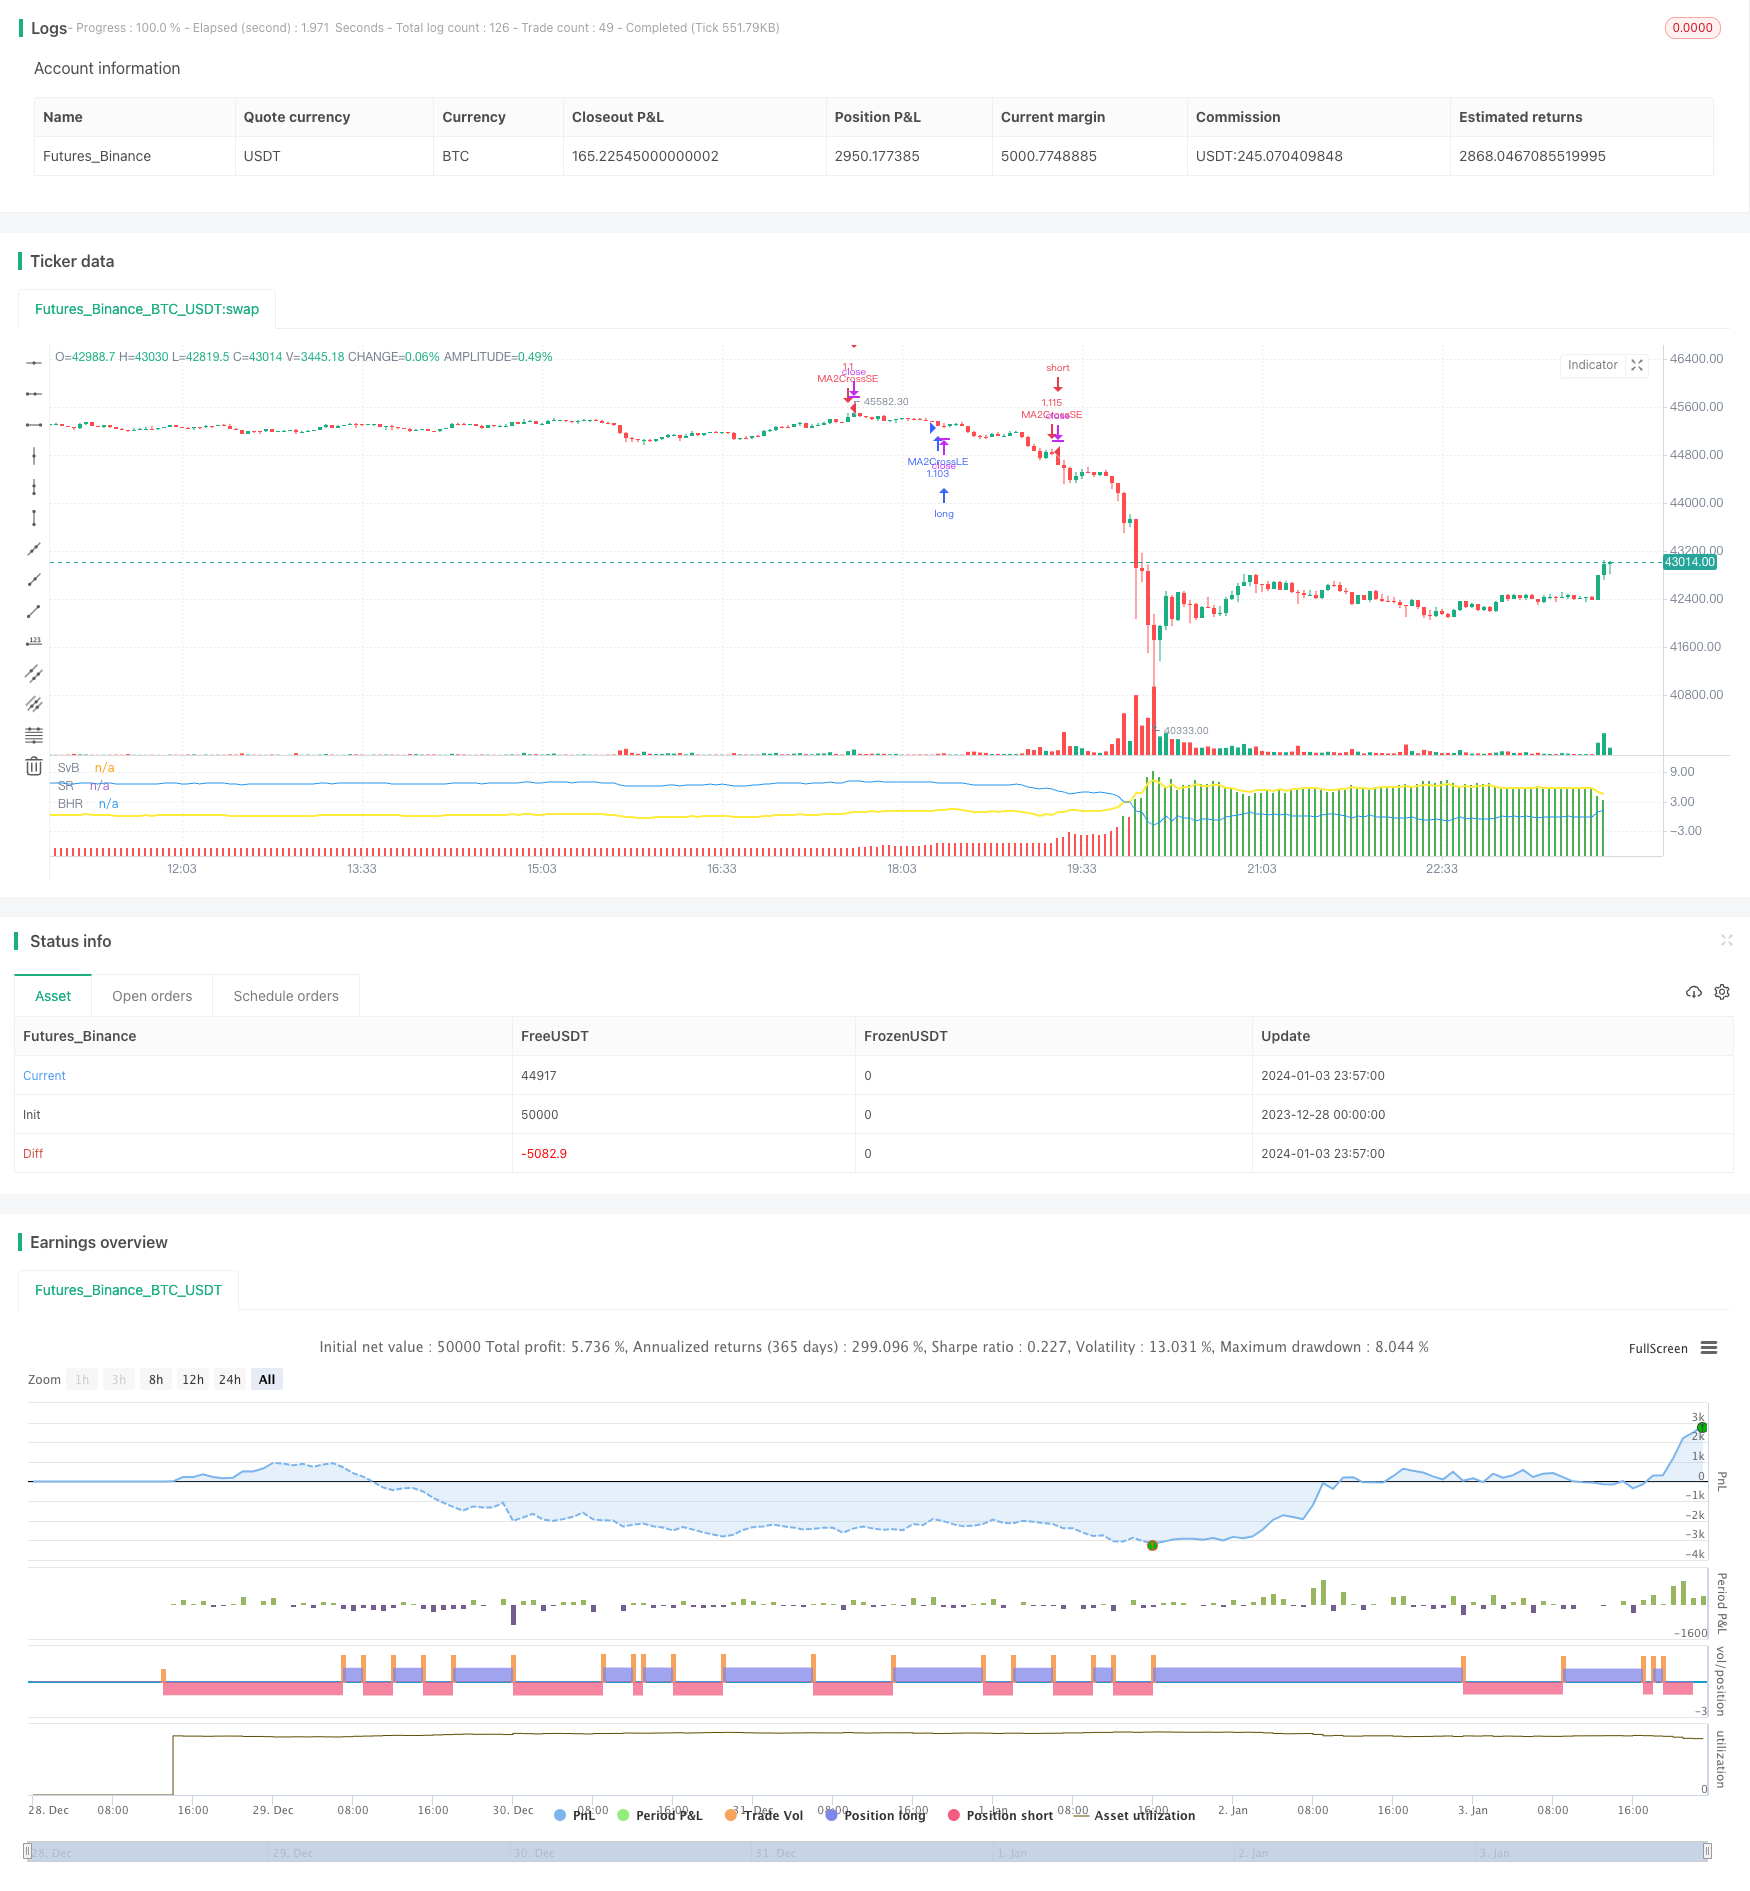
概述
该策略通过详细的指标和图表,来直观地比较给定策略和所交易证券的买入持有收益。
策略原理
该策略的核心逻辑是绘制四个关键要素来比较给定策略和买入持有策略之间的差异:
- 策略净利润:策略的净利润与未实现利润之和
- 买入持有净利润:未实现收益
- 差值:策略净利润 - 买入持有净利润
- 策略VS买入持有统计指标
- 策略净利润高于买入持有的Bar百分比
- 策略净利润低于买入持有的Bar百分比
- 策略与买入持有的平均差值
通过比较以上四个要素,可以清晰直观地了解策略与简单买入持有之间的优劣。
策略优势分析
相比于简单的买入持有收益比较,该策略有以下几个优势:
更全面和细致的比较指标。包括每根K线上的比较、整体统计数据的比较等,让我们可以更清楚地知道策略在哪些地方胜过或输给了买入持有。
直观的比较图表。通过绘制策略净利润、买入持有净利润和两者差值的图表,可以让我们通过视觉更快速地判断策略的表现。
可自定义的比较时间段。我们可以选择仅关注策略在某个时间段内与买入持有的比较,以便更好地分析策略的表现。
简单易用。该策略内置了完整的比较逻辑,我们只需要将自己的策略代码替换模板中对应的位置即可。无需自己编写比较逻辑。
风险分析
该策略主要依赖交易平台中自带的买入持有收益指标进行比较。如果该内置指标有偏差,则会影响最终的比较结果。此外,策略中统计指标的计算方法可能也存在瑕疵,无法百分之百准确地反映策略与买入持有之间的比较情况。
可以通过跟更多的基准进行比较、引入更多统计学方法等手段进一步验证策略的表现。如果交易平台升级后买入持有收益指标产生了较大偏差,也需要调整策略中的比较逻辑。
优化方向
该策略可以从以下几个方面进行优化:
增加更多基准进行三方或者多方比较。例如可以增加对等指数或行业标的的比较。
增加更多统计指标。比如每年、每季度的胜率,最大回撤时间差异等等。让我们可以从更多维度理解策略。
增加参数化配置。让用户可以自定义比较的时间段以外的更多内容,例如比较基准、统计指标等。
优化图表展示。目前简单的线图展示可能难以看清策略与买入持有在具体哪些时间点上的比较,可以考虑绘制柱状图或增加标记来提高可读性。
总结
本策略通过设计多个详细的比较指标和直观的图表展示,使我们可以非常清晰全面地理解自定义策略与简单买入持有策略之间的差异,从而帮助我们更好地改进策略的表现。其可自定义的比较时间段也使我们可以灵活地分析策略在不同阶段的优劣。
如果继续丰富比较基准、统计指标以及图表展示,该策略可以成为一个极其强大的策略分析工具。它为我们提供了一个模板和框架,使策略分析和改进的工作变得更加高效。
/*backtest
start: 2023-12-28 00:00:00
end: 2024-01-04 00:00:00
period: 3m
basePeriod: 1m
exchanges: [{"eid":"Futures_Binance","currency":"BTC_USDT"}]
*/

//@version=4
strategy("VS Buy Hold", precision=2)

bnh_info_panel = input(true, title='Enable Info Panel')
bnh_indicator_panel = input(true, title='Enable Indicator Panel')

//COMPARISON DATE RANGE//
bnh_FromYear = input(1970, title="From Year", minval=1970)
bnh_FromMonth = input(1, title="From Month", minval=1, maxval=12)
bnh_FromDay = input(1, title="From Day", minval=1, maxval=31)

bnh_ToYear = input(2050, title="To Year", minval=2010)
bnh_ToMonth = input(12, title="To Month", minval=1, maxval=12)
bnh_ToDay = input(31, title="To Day", minval=1, maxval=31)

bnh_start = timestamp(bnh_FromYear, bnh_FromMonth, bnh_FromDay, 00, 00)
bnh_finish = timestamp(bnh_ToYear, bnh_ToMonth, bnh_ToDay, 23, 59)
bnh_timeCond = time >= bnh_start and time <= bnh_finish ? true: false

//Note: If you are going to use the COMPARISON DATE RANGE above, apply bnh_timeCond
//      to your strategy parameters.


/////////////////////////////////////////////////////////////////////////////////////
//////////////////////////////STRATEGY SCRIPT START//////////////////////////////////

//=========================PLACEHOLDER MA CROSS STRATEGY=========================//
fastLength = 50
slowLength = 200
price = close

mafast = sma(price, fastLength)
maslow = sma(price, slowLength)
strategy.initial_capital = 50000
positionSize = strategy.initial_capital / close

if (crossover(mafast, maslow) and bnh_timeCond) // <= bnh_timeCond added as a condition
    strategy.entry("MA2CrossLE", strategy.long, positionSize, comment="MA2CrossLE")

if (crossunder(mafast, maslow) and bnh_timeCond) // <= bnh_timeCond added as a condition
    strategy.entry("MA2CrossSE", strategy.short, positionSize, comment="MA2CrossSE")

//////////////////////////////STRATEGY SCRIPT END////////////////////////////////////
/////////////////////////////////////////////////////////////////////////////////////


//STRATEGY EQUITY
strategy_pnl = strategy.netprofit + strategy.openprofit
bnh_strategy_pnl_pcnt = (strategy_pnl / strategy.initial_capital) * 100


//BUY AND HOLD EQUITY
float bnh_start_bar = na
bnh_start_bar := na(bnh_start_bar[1]) and bnh_timeCond? close : bnh_start_bar[1]
bnl_buy_hold_equity = ((close - bnh_start_bar)/bnh_start_bar) * 100


//STRATEGY VS BUY AND HOLD STATS
bnh_vs_diff = bnh_strategy_pnl_pcnt - bnl_buy_hold_equity

bnh_bar_counter = 0
bnh_bar_counter := bnh_vs_diff > 0 ? nz(bnh_bar_counter[1]) + 1 : bnh_bar_counter[1]

bnh_bar_counter2 = 0
bnh_bar_counter2 := bnh_vs_diff <= 0 ? nz(bnh_bar_counter2[1]) + 1 : bnh_bar_counter2[1]

bnh_pcnt_above = (bnh_bar_counter/(bnh_bar_counter + bnh_bar_counter2))*100
bnh_pcnt_below = (bnh_bar_counter2/(bnh_bar_counter + bnh_bar_counter2))*100

bnh_average_diff = cum(bnh_vs_diff) / (bnh_bar_counter + bnh_bar_counter2)


//PLOTS AND LABELS
bnh_diff_color = bnh_vs_diff > 0 ? color.green : color.red
plot(bnh_vs_diff, style=plot.style_columns, color=bnh_diff_color, transp=60, title='SvB')
plot(bnh_strategy_pnl_pcnt, color=color.yellow, linewidth=2, title="SR")
plot(bnl_buy_hold_equity, color=color.blue, title="BHR")

// draw_IndicatorLabel(_text, _x, _y, label_color, font_color)=>
//     string_text = _text
//     var label la_indicator = na
//     label.delete(la_indicator)
//     la_indicator := label.new(
//          x=_x, y=_y,
//          text=string_text, xloc=xloc.bar_index, yloc=yloc.price,
//          color=label_color, style=label.style_labeldown, textcolor=font_color, size=size.small)

// draw_InfoPanel(_text, _x, _y, font_size)=>
//     var label la_panel = na
//     label.delete(la_panel)
//     la_panel := label.new(
//          x=_x, y=_y,
//          text=_text, xloc=xloc.bar_time, yloc=yloc.price,
//          color=color.new(#383838, 5), style=label.style_labelup, textcolor=color.white, size=font_size)

// if bnh_indicator_panel
//     draw_IndicatorLabel("Difference", bar_index, bnh_vs_diff, color.new(color.gray, 40), color.white)
//     draw_IndicatorLabel("Strategy P/L", bar_index, bnh_strategy_pnl_pcnt, color.new(color.yellow, 50), color.white)
//     draw_IndicatorLabel("Buy & Hold P/L", bar_index, bnl_buy_hold_equity, color.new(color.blue, 50), color.white)

// info_panel_x = time_close + round(change(time) * 200)
// info_panel_y = max(max(bnl_buy_hold_equity, bnh_strategy_pnl_pcnt), bnh_vs_diff) + abs(bnh_vs_diff * 0.25)


// title = "STRATEGY vs BUY & HOLD STATS"
// row0 = "-----------------------------------------------------"
// row1 = 'Bars Above Buy & Hold: ' + tostring(bnh_pcnt_above, '#.##') + '%'
// row2 = 'Bars Below Buy & Hold: ' + tostring(bnh_pcnt_below, '#.##') + '%'
// row3 = 'All Time Ave. Difference: ' + tostring(bnh_average_diff, '#.##') + '%'

// panel_text = '\n' + title + '\n' + row0 + '\n' + row1 + '\n\n' + row2 + '\n\n' + row3 + '\n'

// if bnh_info_panel
//     draw_InfoPanel(panel_text, info_panel_x, info_panel_y, size.normal)