概述
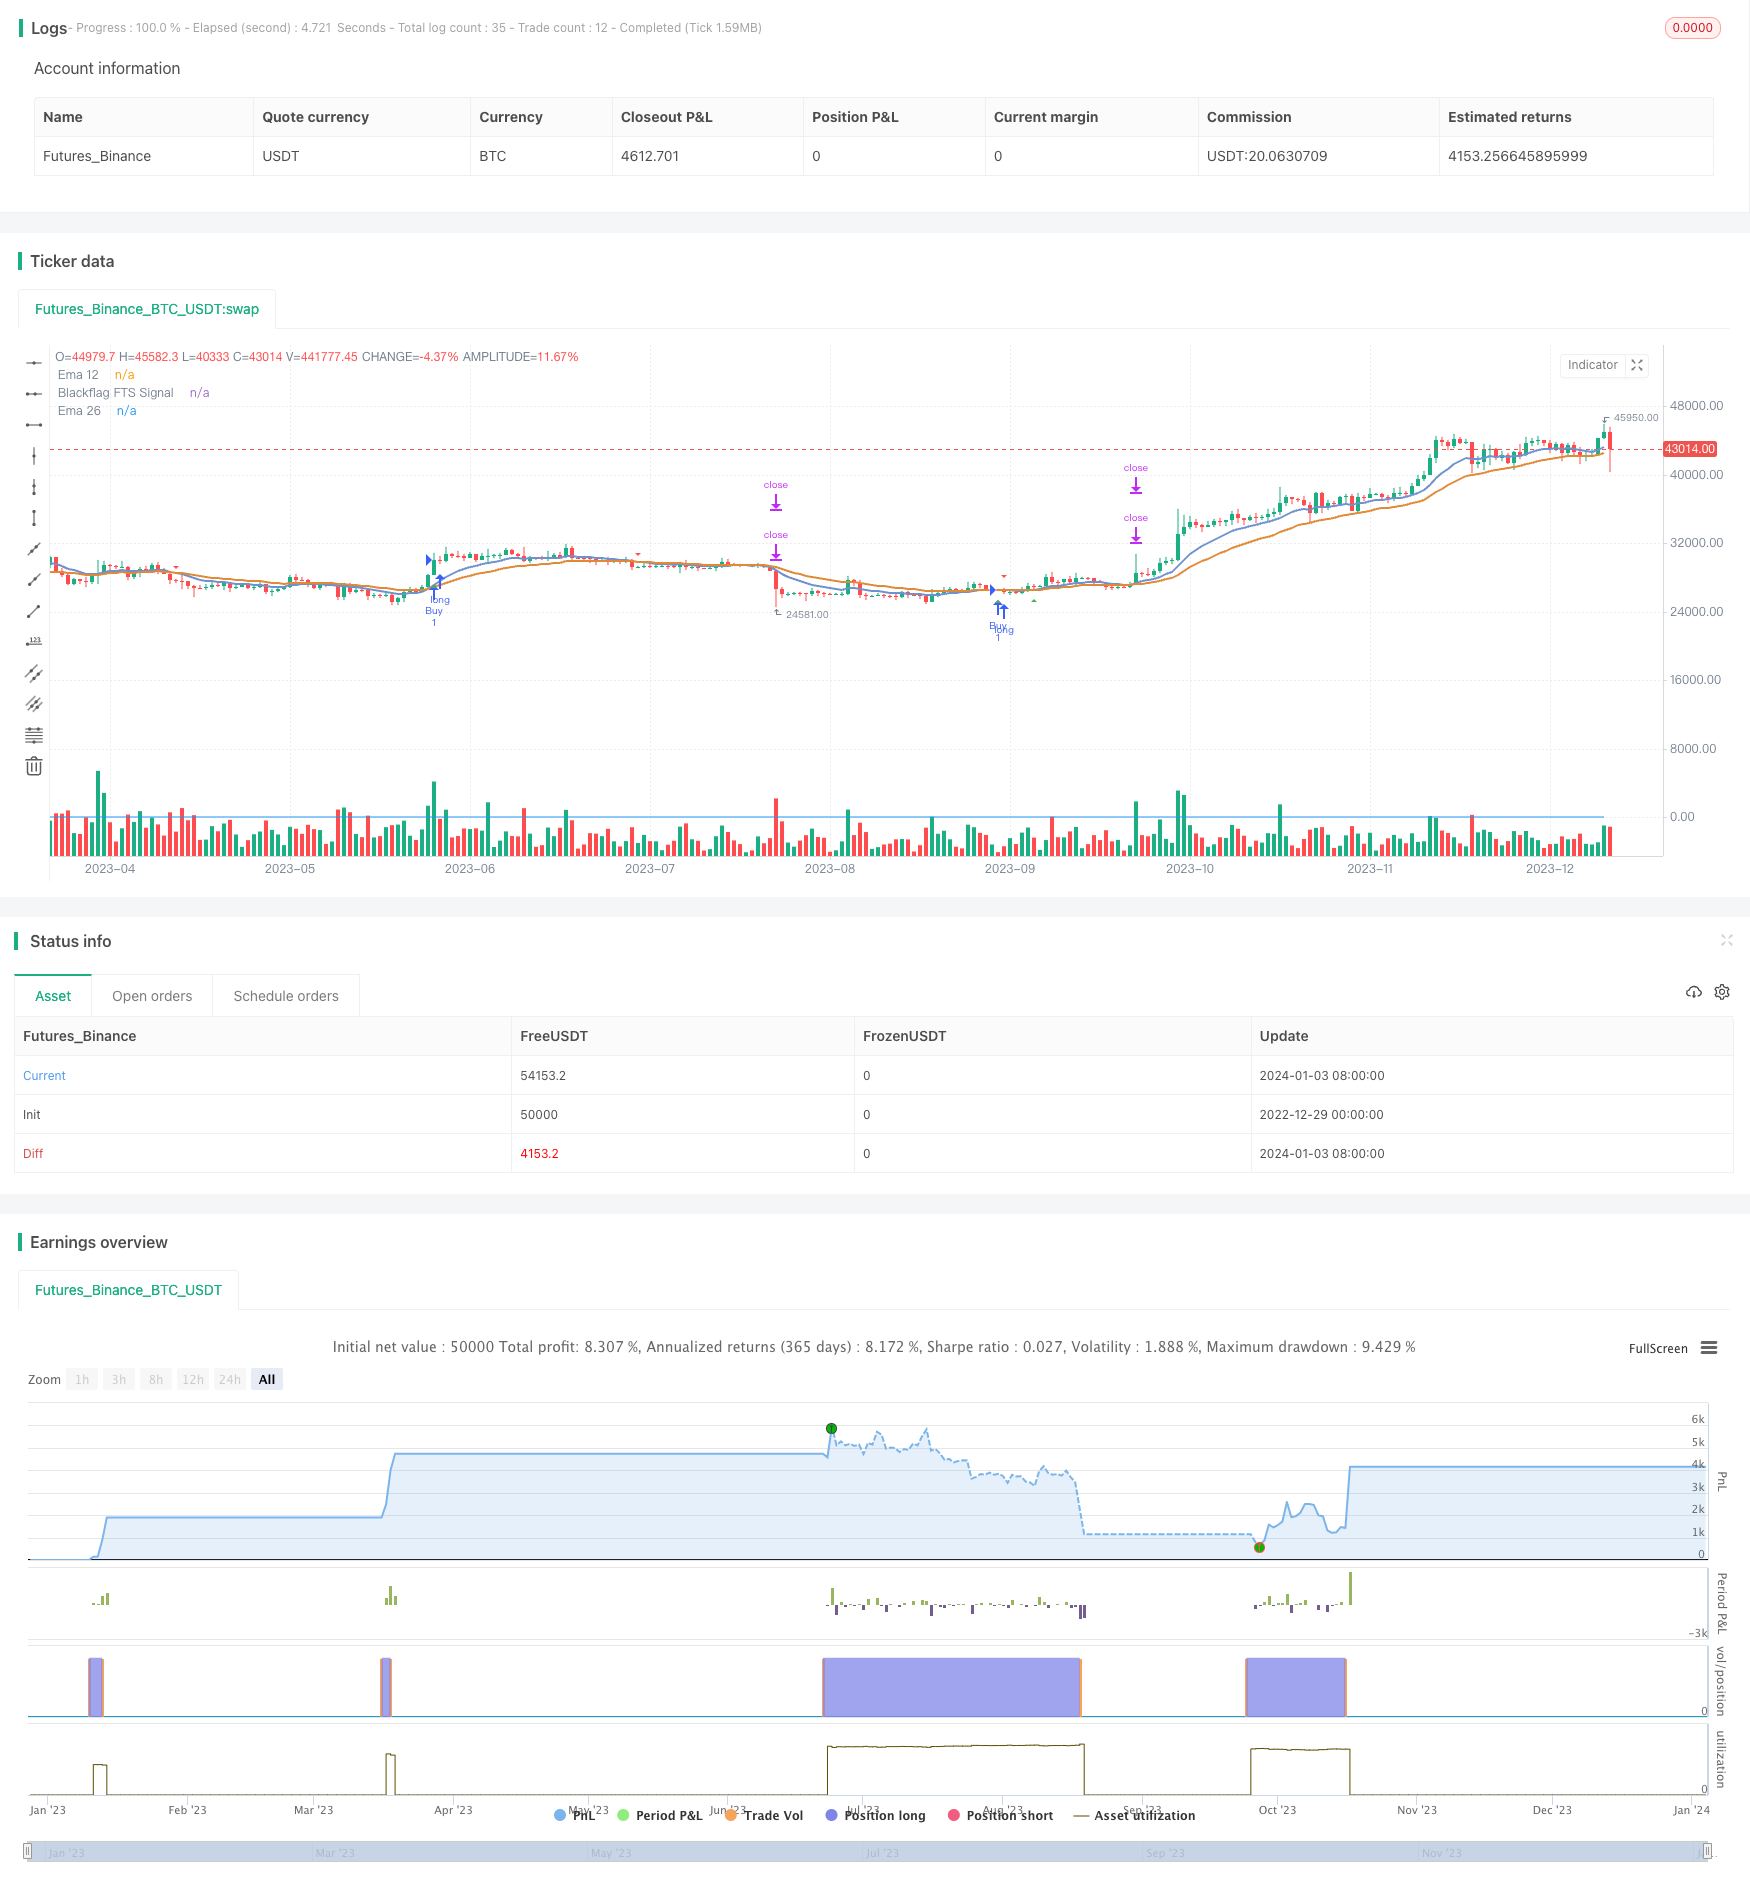
渔夫转身EMA多重止损多重止盈策略结合了指标EMA和自定义的渔夫转身信号,实现了趋势跟踪交易。当短周期EMA上穿长周期EMA并且渔夫转身信号大于0时产生买入信号。该策略设置了两个止盈点和一个动态止损点来锁定利润和控制风险。第一个止盈点为2倍ATR,第二个止盈点为3倍ATR,止损点为1倍ATR。当第一个止盈点被触发后,止损点会移动到入场价格。该策略适用于寻找潜在趋势交易机会的GDAX交易所。
策略原理
该策略主要基于两个技术指标: 1. EMA:指数移动平均线。策略中使用12周期和26周期的EMA。 2. 自定义的渔夫转身信号。该信号基于一定周期内价格的最高点和最低点的差值计算。
当短周期EMA上穿长周期EMA时产生买入信号。此外,渔夫转身信号线也必须大于0,表示当前处于上涨趋势。
止盈和止损规则如下: 1. 第一个止盈点为2倍ATR 2. 第二个止盈点为3倍ATR 3. 止损点为1倍ATR 4. 当第一个止盈点被触发后,止损点会移动到入场价格
该策略可以通过调整EMA周期、渔夫转身信号周期和ATR周期等参数进行优化。
策略优势
该策略结合趋势跟踪指标和风险管理指标,具有以下优势:
- 使用EMA捕捉趋势方向
- 自定义渔夫转身信号过滤假突破
- 多个止盈点锁定利润
- 动态止损控制风险
- 可调参数适应不同市场环境
策略风险
该策略也存在一些风险:
- 趋势反转造成止损被触发
- 参数设置不当导致过于激进入场或前期退出
- 自定义渔夫转身信号可能存在效果不佳的市场环境
可以通过优化参数、组合其他指标和人工干预等方式减少这些风险。
优化方向
该策略可以从以下几个方面进行优化:
- 优化EMA周期参数,适应更多市场环境
- 组合其他趋势指标验证买入信号
- 添加整体市场过滤,避免不确定环境的误入场
- 优化渔夫转身信号参数或尝试其他自定义指标
- 增加止盈档位数量,锁定更多利润
- 整合自动止盈移位功能
通过测试不同参数设置和指标组合,可以持续提升策略表现。
总结
渔夫转身EMA多重止损多重止盈策略,整合了趋势跟踪和风险管理的优势,是一个值得长期验证优化的有潜力的策略。参数调整和指标组合还有很大的优化空间,希望您在实盘验证中能取得稳定的超额收益!
策略源码
/*backtest
start: 2022-12-29 00:00:00
end: 2024-01-04 00:00:00
period: 1d
basePeriod: 1h
exchanges: [{"eid":"Futures_Binance","currency":"BTC_USDT"}]
*/

// This source code is subject to the terms of the Mozilla Public License 2.0 at https://mozilla.org/MPL/2.0/
// © Eliebf13
//@version=4
strategy("GDAX EMA & Blackflag FTS Strategy with Multiple Take Profits and Dynamic Stop Loss", overlay=true)

// Input parameters for Blackflag FTS
fts_length = input(14, title="Blackflag FTS Length")
atr_length = input(14, title="ATR Length")

// GDAX EMA calculation
short = ema(close, 12)
long = ema(close, 26)

// Calculate Blackflag FTS signal line manually
up = 0.0
down = 0.0
for i = 0 to fts_length - 1
    up := up + (high[i] - low[i])
    down := down + (high[i] - low[i])

fts_value = down == 0 ? 100 : 100 - (100 / (1 + (up / down)))

// Buy condition: GDAX EMA crossover and Blackflag FTS signal above zero
buy_condition = crossover(short, long) and fts_value > 0

// ATR calculation
atr_value = atr(atr_length)

// Calculate Stop Loss and Take Profit levels
stop_loss_level = close - atr_value
take_profit_level1 = close + 2 * atr_value
take_profit_level2 = close + 3 * atr_value

// Sell condition: GDAX EMA crossunder or Blackflag FTS signal below zero
sell_condition = crossunder(short, long) or fts_value < 0

// Strategy orders with Multiple Take Profits and Dynamic Stop Loss
strategy.entry("Buy", strategy.long, when = buy_condition)

// Calculate position size for 50% closure at each take profit level
position_size = strategy.position_size
target_position_size1 = position_size * 0.5
target_position_size2 = position_size * 1

strategy.exit("Take Profit 1", from_entry="Buy", loss=close, profit=take_profit_level1, qty=target_position_size1)
strategy.exit("Take Profit 2/Move Stop Loss", from_entry="Buy", loss=close, profit=take_profit_level2, qty=target_position_size2)

// Plot GDAX EMA lines
plot(short, color=#6f92ce, linewidth=2, title="Ema 12")
plot(long, color=#e08937, linewidth=2, title="Ema 26")

// Plot Blackflag FTS signal
plot(fts_value, color=color.blue, title="Blackflag FTS Signal")

// Plot buy and sell signals on the chart
plotshape(series=buy_condition, location=location.belowbar, color=color.green, style=shape.triangleup, title="Buy Signal")
plotshape(series=sell_condition, location=location.abovebar, color=color.red, style=shape.triangledown, title="Sell Signal")