概述
该策略是一个利用RSI、MACD和移动平均线的组合策略。它在判断入市时点时融合了RSI的超买超卖信号、MACD的敏感性和移动平均线的指标效应。
策略原理
该策略主要判断以下四个条件来决定做多入市:
- MACD的柱线大于设置的多头进入参数;
- RSI大于50,表示处于超买状态;
- 短期EMA上穿长期EMA,形成黄金交叉;
- 收盘价上穿长期EMA,并且高于长期EMA加上ATR止损幅度。
当以下两个出场条件成立时,策略会平仓止损:
- MACD的柱线小于设置的止损参数;
- 短期EMA下破长期EMA成死叉。
这样,策略在盈利回撤时及时止损,避免出现较大亏损。
优势分析
该策略最大的优势在于指标的组合使用,发挥了各个指标的优势,具体来说:
- RSI的应用避免了在震荡行情中反复开仓带来的交易费用损耗。
- MACD柱形指标的灵敏度确保了及时捕捉到行情转折点。
- 移动平均线过滤了短线市场噪音,发挥其指标效应。
风险及解决方法
该策略主要存在以下两方面的风险:
回撤风险较大。移动平均线等趋势型策略最大的风险在于行情反转带来的较大回撤。可通过降低仓位规模、止损设置来积极控制回撤。
参数优化难度大。多指标组合策略参数设置与优化难度都较大。可采用步进法、遗传算法等参数优化方法来确定最优参数。
优化思路
该策略可从以下几个方面继续优化:
增加附加条件,进一步过滤假信号。例如结合交易量指标、波动率指标等。
测试不同品种参数设置差异。调整参数适应更多品种。
优化移动平均线参数设置。测试不同长度参数的差异。
研究采用自适应移动平均线。根据市场环境switch不同参数组合。
总结
本策略总体来说是一个典型的优化版移动平均线与趋势跟踪策略。它吸收了MACD、RSI等多个主流指标的优点,在判断入市时机和止损方面都有独到之处。下一步,可从参数优化、风险控制等多方面进行改进,使策略参数更加鲁棒、符合更多品种,从而获得更高的稳定性。
策略源码
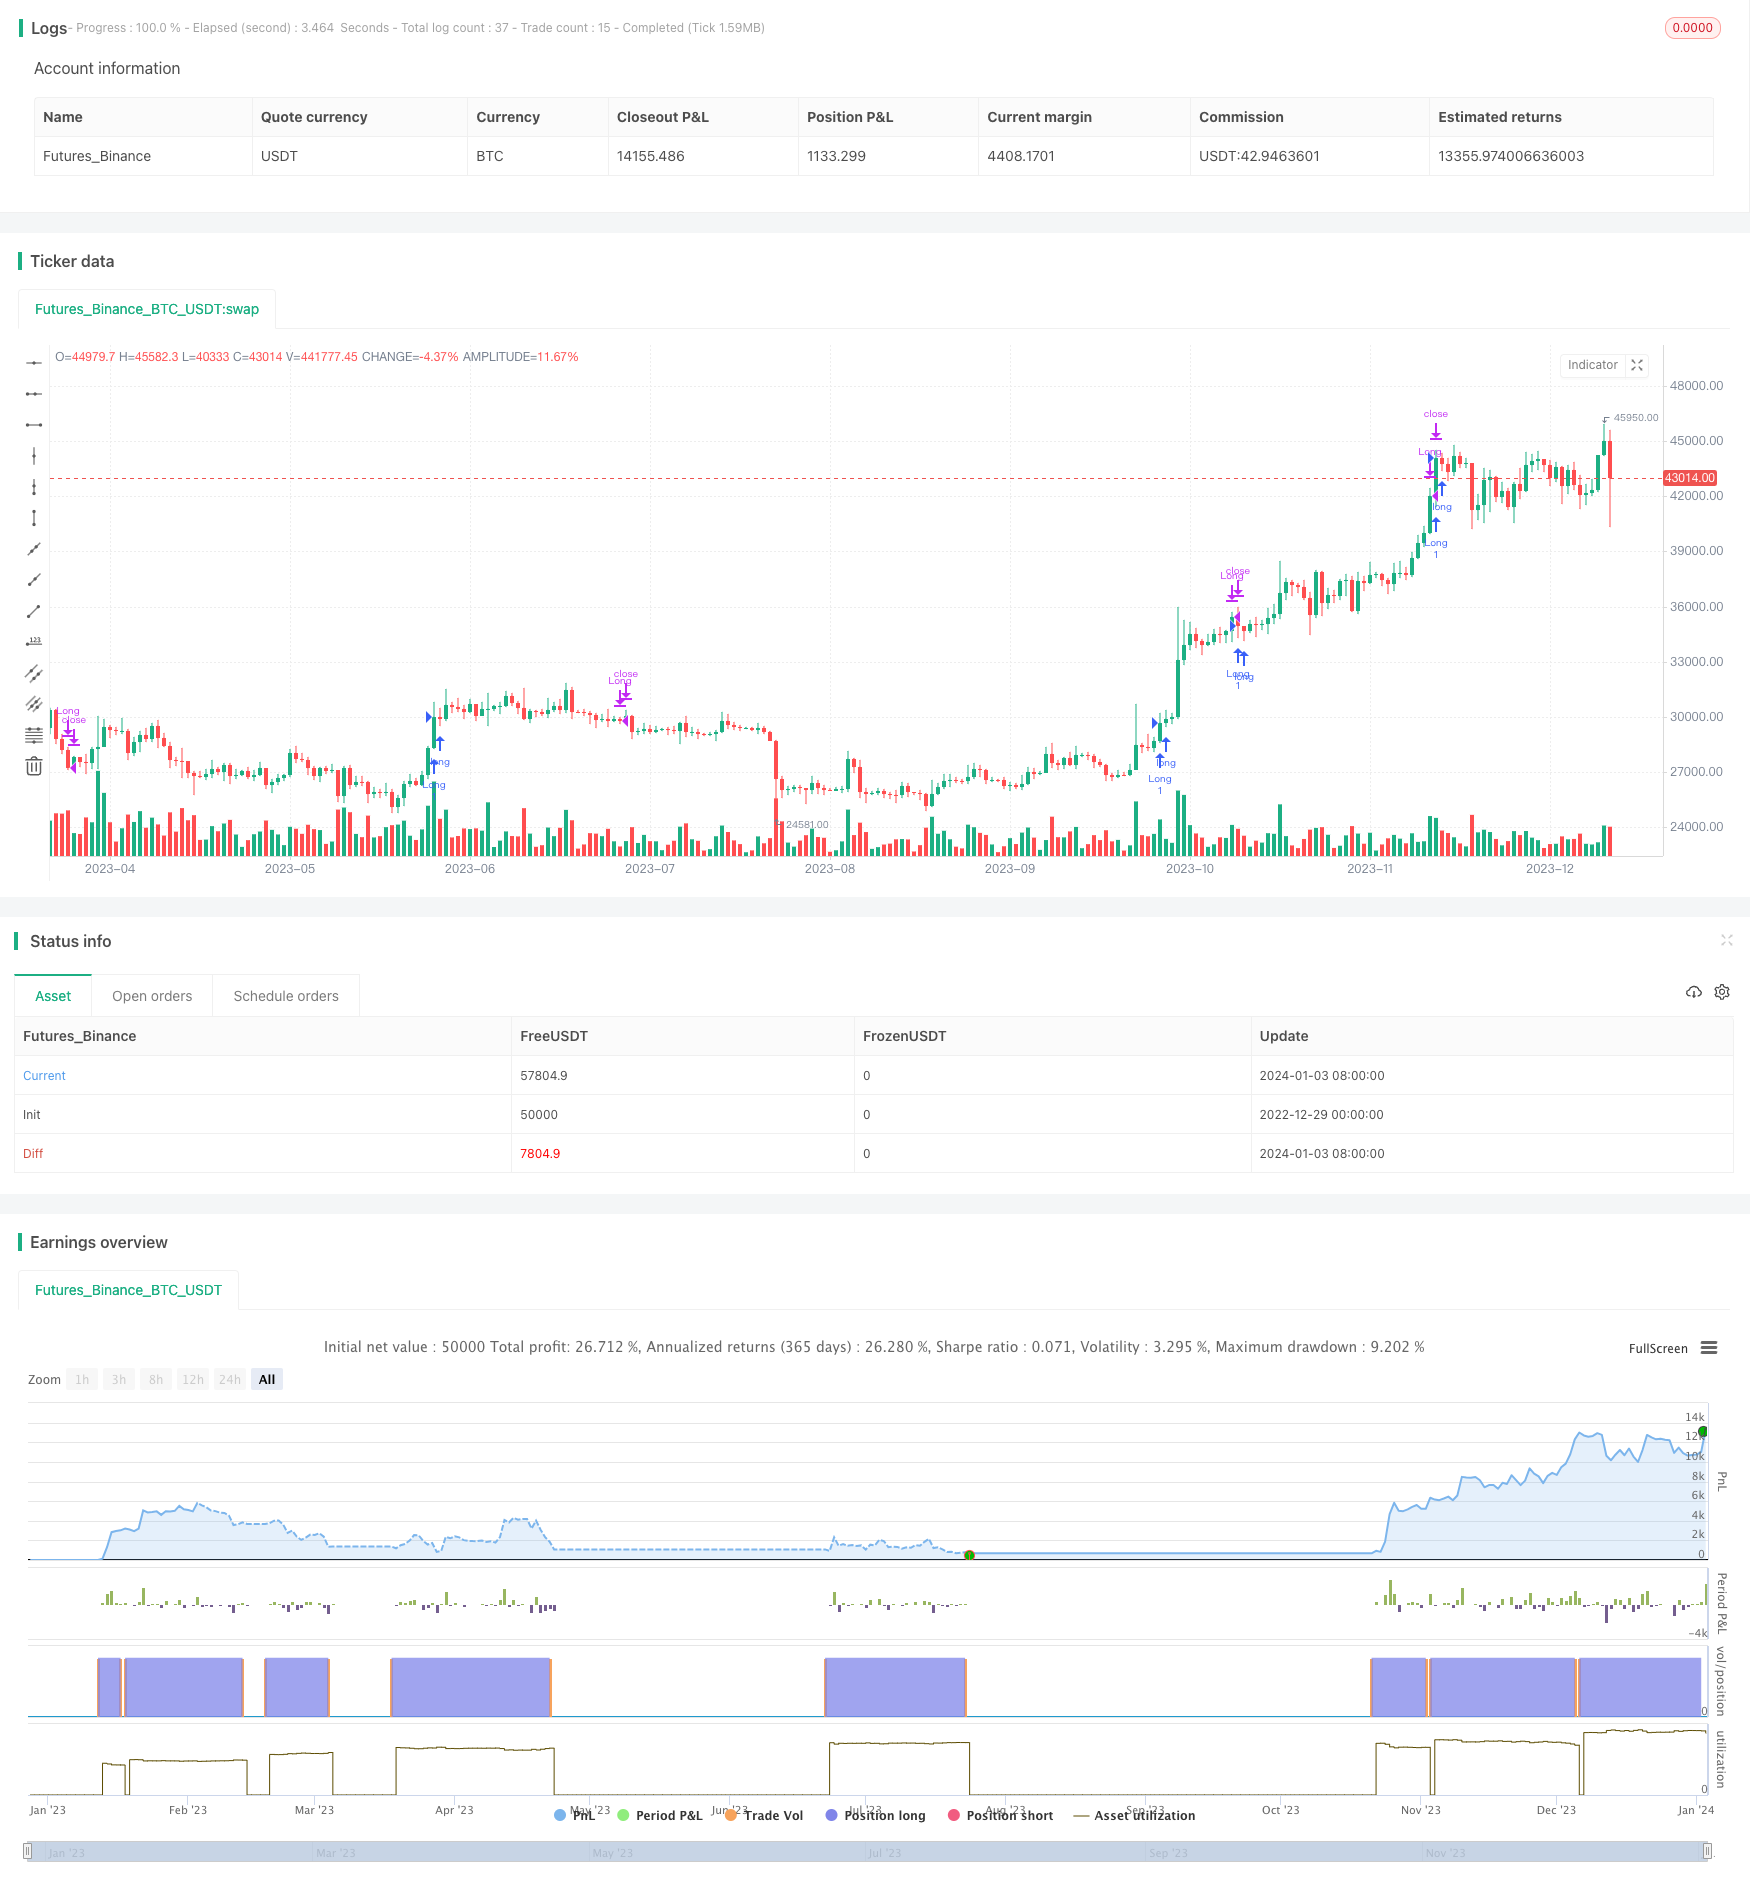
/*backtest
start: 2022-12-29 00:00:00
end: 2024-01-04 00:00:00
period: 1d
basePeriod: 1h
exchanges: [{"eid":"Futures_Binance","currency":"BTC_USDT"}]
*/

//@version=5
strategy("Improved RSI MACD Strategy with Moving Averages", overlay=true)

// Inputs
src = input(close, title="RSI Source")

// RSI Settings
lengthRSI = input.int(14, minval=1)

// Stop Loss Settings
stopLossPct = input.float(0.09, title="Stop Loss Percentage")
takeProfitPct = input.float(0.15, title="Take Profit Percentage")

// MACD Settings
fastlen = input(12)
slowlen = input(26)
siglen = input(9)

// Strategy Settings
longEntry = input(0, title="Long Entry Level")
exitLevel = input(0, title="Exit Level")

// EMA Settings
emaShortLength = input(8, title="Short EMA Length")
emaLongLength = input(21, title="Long EMA Length")

atrMultiplier = input.float(2, title="atrMultiplier")
atrLength = input.int(20, title="atrLength")

// Indicators
rsi1 = ta.rsi(src, lengthRSI)
[macd, signal, hist] = ta.macd(src, fastlen, slowlen, siglen)

// Calculate EMAs
emaShort = ta.ema(src, emaShortLength)
emaLong = ta.ema(src, emaLongLength)

// Calculate ATR
atr = ta.atr(atrLength)

// Variables
var bool canEnterLong = na

// Strategy conditions
longCondition = hist > longEntry and rsi1 > 50 and emaShort > emaLong and close > emaLong + atrMultiplier * atr

// Entries and Exits
if hist < exitLevel and emaShort < emaLong
    canEnterLong := true
    strategy.close("Long")

// Store last entry price
var lastEntryPrice = float(na)
var lastEntryPrice2 = float(na)
if longCondition
    strategy.entry("Long", strategy.long)
    canEnterLong := false
    lastEntryPrice := close
if lastEntryPrice < close
    lastEntryPrice := close
// Calculate Stop Loss and Take Profit Levels based on last entry price
stopLossLevel = lastEntryPrice * (1 - stopLossPct)

// Check for stop loss and take profit levels and close position if triggered
if (strategy.position_size > 0)
    last_buy = strategy.opentrades[0]
    if (close < stopLossLevel)
        strategy.close("Long", comment="Stop Loss Triggered")
    if (close * (1 - takeProfitPct) > strategy.opentrades.entry_price(strategy.opentrades - 1) )
        strategy.close("Long", comment="Take Profit Triggered")