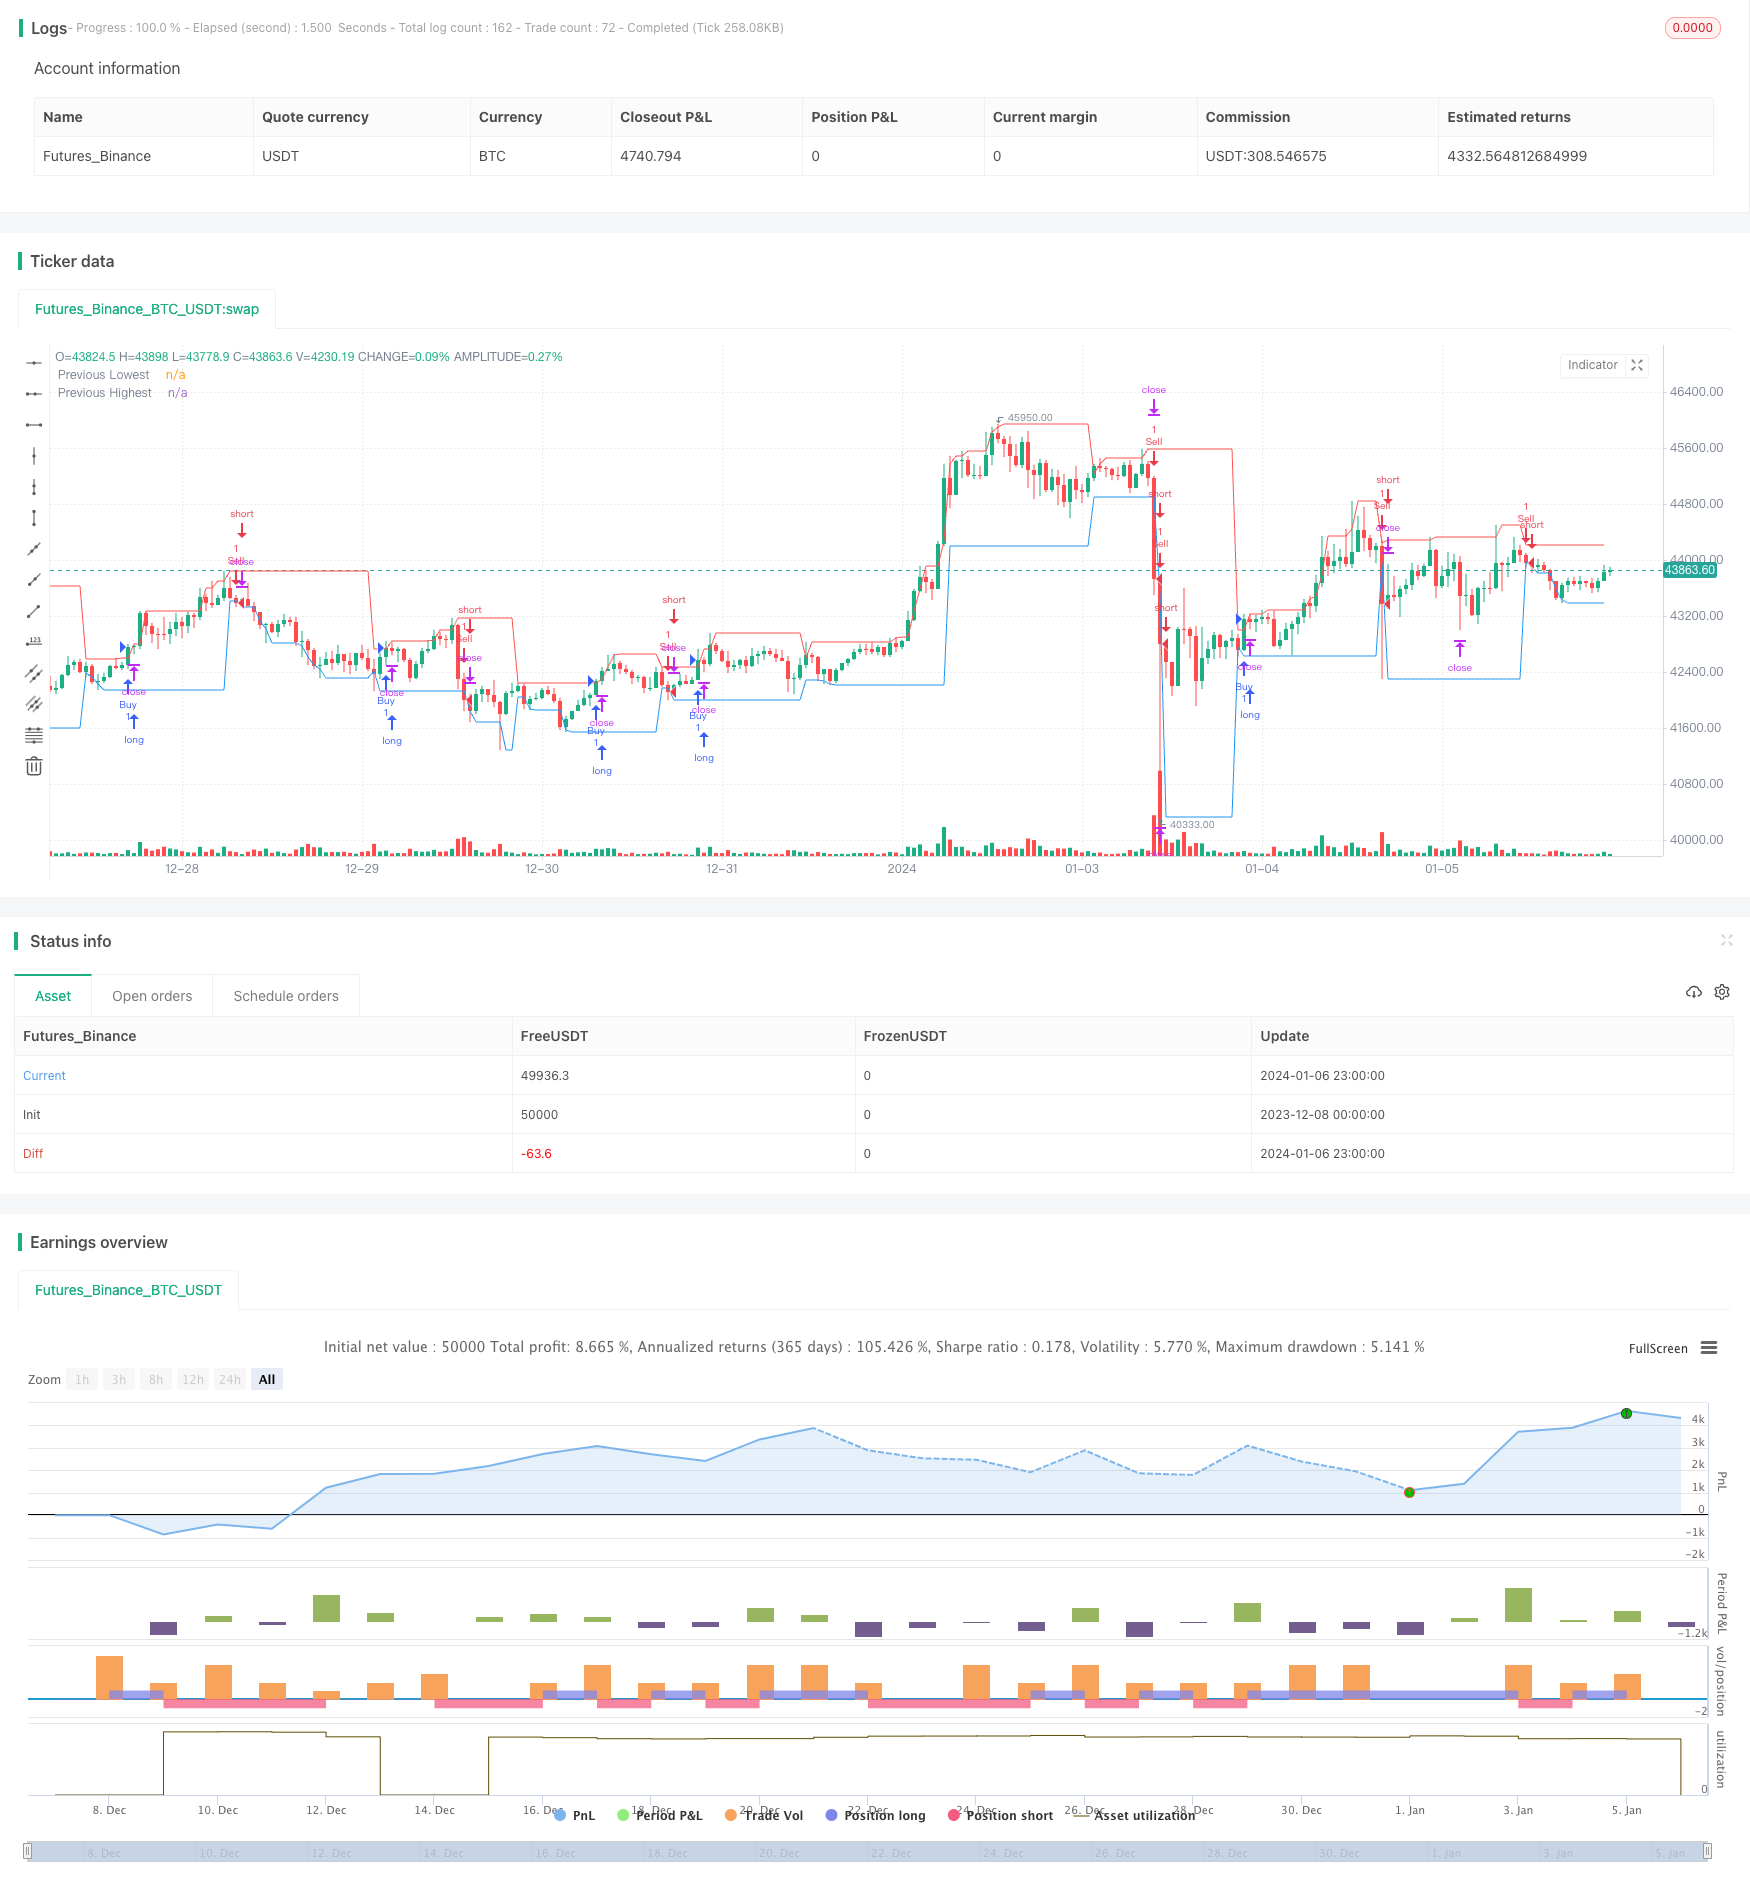
概述
该策略通过比较当前K线和上一根K线的收盘价,来判断是否触发买入或卖出信号。
具体来说,如果当前K线收盘价高于上一根K线的最高价,则触发买入信号;如果当前K线收闭价低于上一根K线的最低价,则触发卖出信号。
策略原理
- 获取指定时间周期(如日线、小时线等)的历史最高价和最低价
- 计算止损距离和止盈距离
- 止损距离 = 上一根K线最高价 - 上一根K线最低价
- 止盈距离 = 止损距离 * 3(设置为1:3的止损止盈比例)
- 判断当前K线收盘价与上一根K线最高价和最低价的关系
- 如果当前收盘价 > 上一根K线最高价,则触发买入信号
- 如果当前收盘价 < 上一根K线最低价,则触发卖出信号
- 入场后设置止损和止盈
- 买入后,设置止损为上一根K线最低价 - 止损距离,止盈为上一根K线最高价 + 止盈距离
- 卖出后,设置止损为上一根K线最高价 + 止损距离,止盈为上一根K线最低价 - 止盈距离
以上就是该策略的基本交易逻辑。
优势分析
- 策略思路清晰简单,容易理解实现
- 利用K线信息判断趋势方向
- 有止损止盈机制控制风险
风险分析
- 仅基于一个时间周期K线形态判断,可能产生更多假信号
- 没有考虑更多因素,如交易量变化、波动率等
- 止损止盈设定可能不当,距离过大过小都有风险
优化方向
- 结合更多因素确认入场信号,如交易量、均线等
- 优化止损止盈算法,使止损更合理、止盈更充分
- 不同品种参数设置可能需要调整
- 可以测试更长线周期的效果
总结
该策略整体思路简单清晰,利用K线收盘价信息判断趋势方向,同时设置止损止盈控制风险,可以作为股票、数字货币交易的基础策略。但仅仅基于单个时间周期K线形态,容易产生假信号,优化空间还很大,需要进一步考虑结合更多因素以及参数调整,从而改进策略效果。
策略源码
/*backtest
start: 2023-12-08 00:00:00
end: 2024-01-07 00:00:00
period: 1h
basePeriod: 15m
exchanges: [{"eid":"Futures_Binance","currency":"BTC_USDT"}]
*/

//@version=5
strategy("Buy/Sell on Candle Close", overlay=true)

var float prevLowest = na
var float prevHighest = na
var float slDistance = na
var float tpDistance = na

// Specify the desired timeframe here (e.g., "D" for daily, "H" for hourly, etc.)
timeframe = "D"

// Fetching historical data for the specified timeframe
pastLow = request.security(syminfo.tickerid, timeframe, low, lookahead=barmerge.lookahead_on)
pastHigh = request.security(syminfo.tickerid, timeframe, high, lookahead=barmerge.lookahead_on)

if bar_index > 0
    prevLowest := pastLow[1]
    prevHighest := pastHigh[1]

currentClose = close

if not na(prevLowest) and not na(prevHighest)
    slDistance := prevHighest - prevLowest
    tpDistance := 3 * slDistance // Adjusted for 1:3 risk-reward ratio

// Buy trigger when current close is higher than previous highest
if not na(prevLowest) and not na(prevHighest) and currentClose > prevHighest
    strategy.entry("Buy", strategy.long)
    strategy.exit("Buy TP/SL", "Buy", stop=prevLowest - slDistance, limit=prevHighest + tpDistance)

// Sell trigger when current close is lower than previous lowest
if not na(prevLowest) and not na(prevHighest) and currentClose < prevLowest
    strategy.entry("Sell", strategy.short)
    strategy.exit("Sell TP/SL", "Sell", stop=prevHighest + slDistance, limit=prevLowest - tpDistance)

plot(prevLowest, color=color.blue, title="Previous Lowest")
plot(prevHighest, color=color.red, title="Previous Highest")