EMA Crossover and MACD Signals Trend Following Strategy

Author: ChaoZhang, Date: 2024-01-08 14:31:56
Tags:

img

Overview

This strategy utilizes the EMA crossover system and MACD indicator to identify trend direction. It goes long when a golden cross occurs on the EMA lines judging that an uptrend is established, and it goes short when a death cross occurs on the EMA lines judging that a downtrend has started. To filter signals with high volatility, an additional condition of MACD crossover on both the current and 4-hour timeframes is included to confirm buy or sell signals.

Strategy Logic

The strategy mainly relies on EMA crossover and MACD indicator to capture mid- to long-term price trends. The EMA system consists of 9-period and 21-period EMA. The 9 EMA responds quickly to price changes while the 21 EMA is relatively more stable. When the fast EMA line crosses above the slow EMA line, it generates a golden cross signal indicating an uptrend. When the fast EMA line crosses below the slow EMA line, it generates a death cross signal indicating a downtrend. EMA crossover signals can be affected by price fluctuations within certain periods. To filter false signals, this strategy utilizes MACD crossover on both 1-hour and 4-hour timeframes based on default parameters as an additional confirmation. When both EMA crossover and MACD crossover conditions are met, the strategy enters a position.

So when a trend reversal is identified, how to determine the entry and exit points? This strategy judges an uptrend when price is above EMA 21 and a downtrend when price is below EMA 21. Therefore, when a golden cross happens, a long position will be opened if the close price is higher than EMA 21. When a death cross happens, a short position will be opened if the close price is lower than EMA 21. The rationale here is the support and resistance characteristic of moving average prices. After entering a position, stop loss and take profit prices are set to lock in profits and control risks.

Advantages

  1. Identifying mid- to long-term trend direction based on MA lines and filtering false signals with MACD makes it effective to detect trend reversal points.

  2. The combination of EMA channel and MACD crossover forms multiple layers of verification for trading signals, allowing the strategy to trade when a clear trend is established.

  3. By entering positions around EMA lines and utilizing their support/resistance levels for stop loss/profit taking, good risk reward ratios can be achieved.

  4. The relatively long parameters prevent interference from short-term market fluctuations and suit for mid- to long-term trend following.

Risks

  1. Both moving averages and MACD cannot precisely predict trend reversal points, with some lagging effect. Sudden price changes may trigger late entry with a stop loss hit.

  2. EMA crossovers do not necessarily represent real trend reversals. Signals can be unreliable if volatility of the current market cycle is high.

  3. Inappropriate MACD parameter settings may cause missed or false signals, missing trading opportunities or entering in the wrong direction.

  4. As a trend following strategy, it is vulnerable whipsaws in ranging markets. A stop loss hit may result in big loss in such cases.

Enhancements

  1. Test and optimize EMA period parameters to find the optimal combination, e.g. 20 and 60 days EMA.

  2. Test MACD parameters for the most reliable signal line combination, e.g. fast/slow EMA periods of MACD.

  3. Test and optimize stop loss/profit taking rules to find the most appropriate stop loss percentage, judged by risk-reward ratios.

  4. Incorporate other indicator signals as confirmation for EMA crossovers, e.g. KDJ indicator or Bollinger Bands.

  5. Add adaptive stop loss mechanism to trail stop loss along profit taking price, improving risk control.

Conclusion

This strategy combines the strengths of EMA trading system and MACD indicator in an attempt to capture mid- to long-term trend reversal points. It enters positions upon confirming dual signals and set stop loss/profit taking levels to lock in profits. Further improvements on signal accuracy can be achieved through parameter optimization and incorporating additional indicators. Note that as a trend following strategy, it is vulnerable to whipsaws in the short term. Overall, building upon simple and intuitive technical indicators while forming multi-layer signal verification, this strategy suits for mid- to long-term trend tracking and can achieve decent risk-adjusted returns.


/*backtest
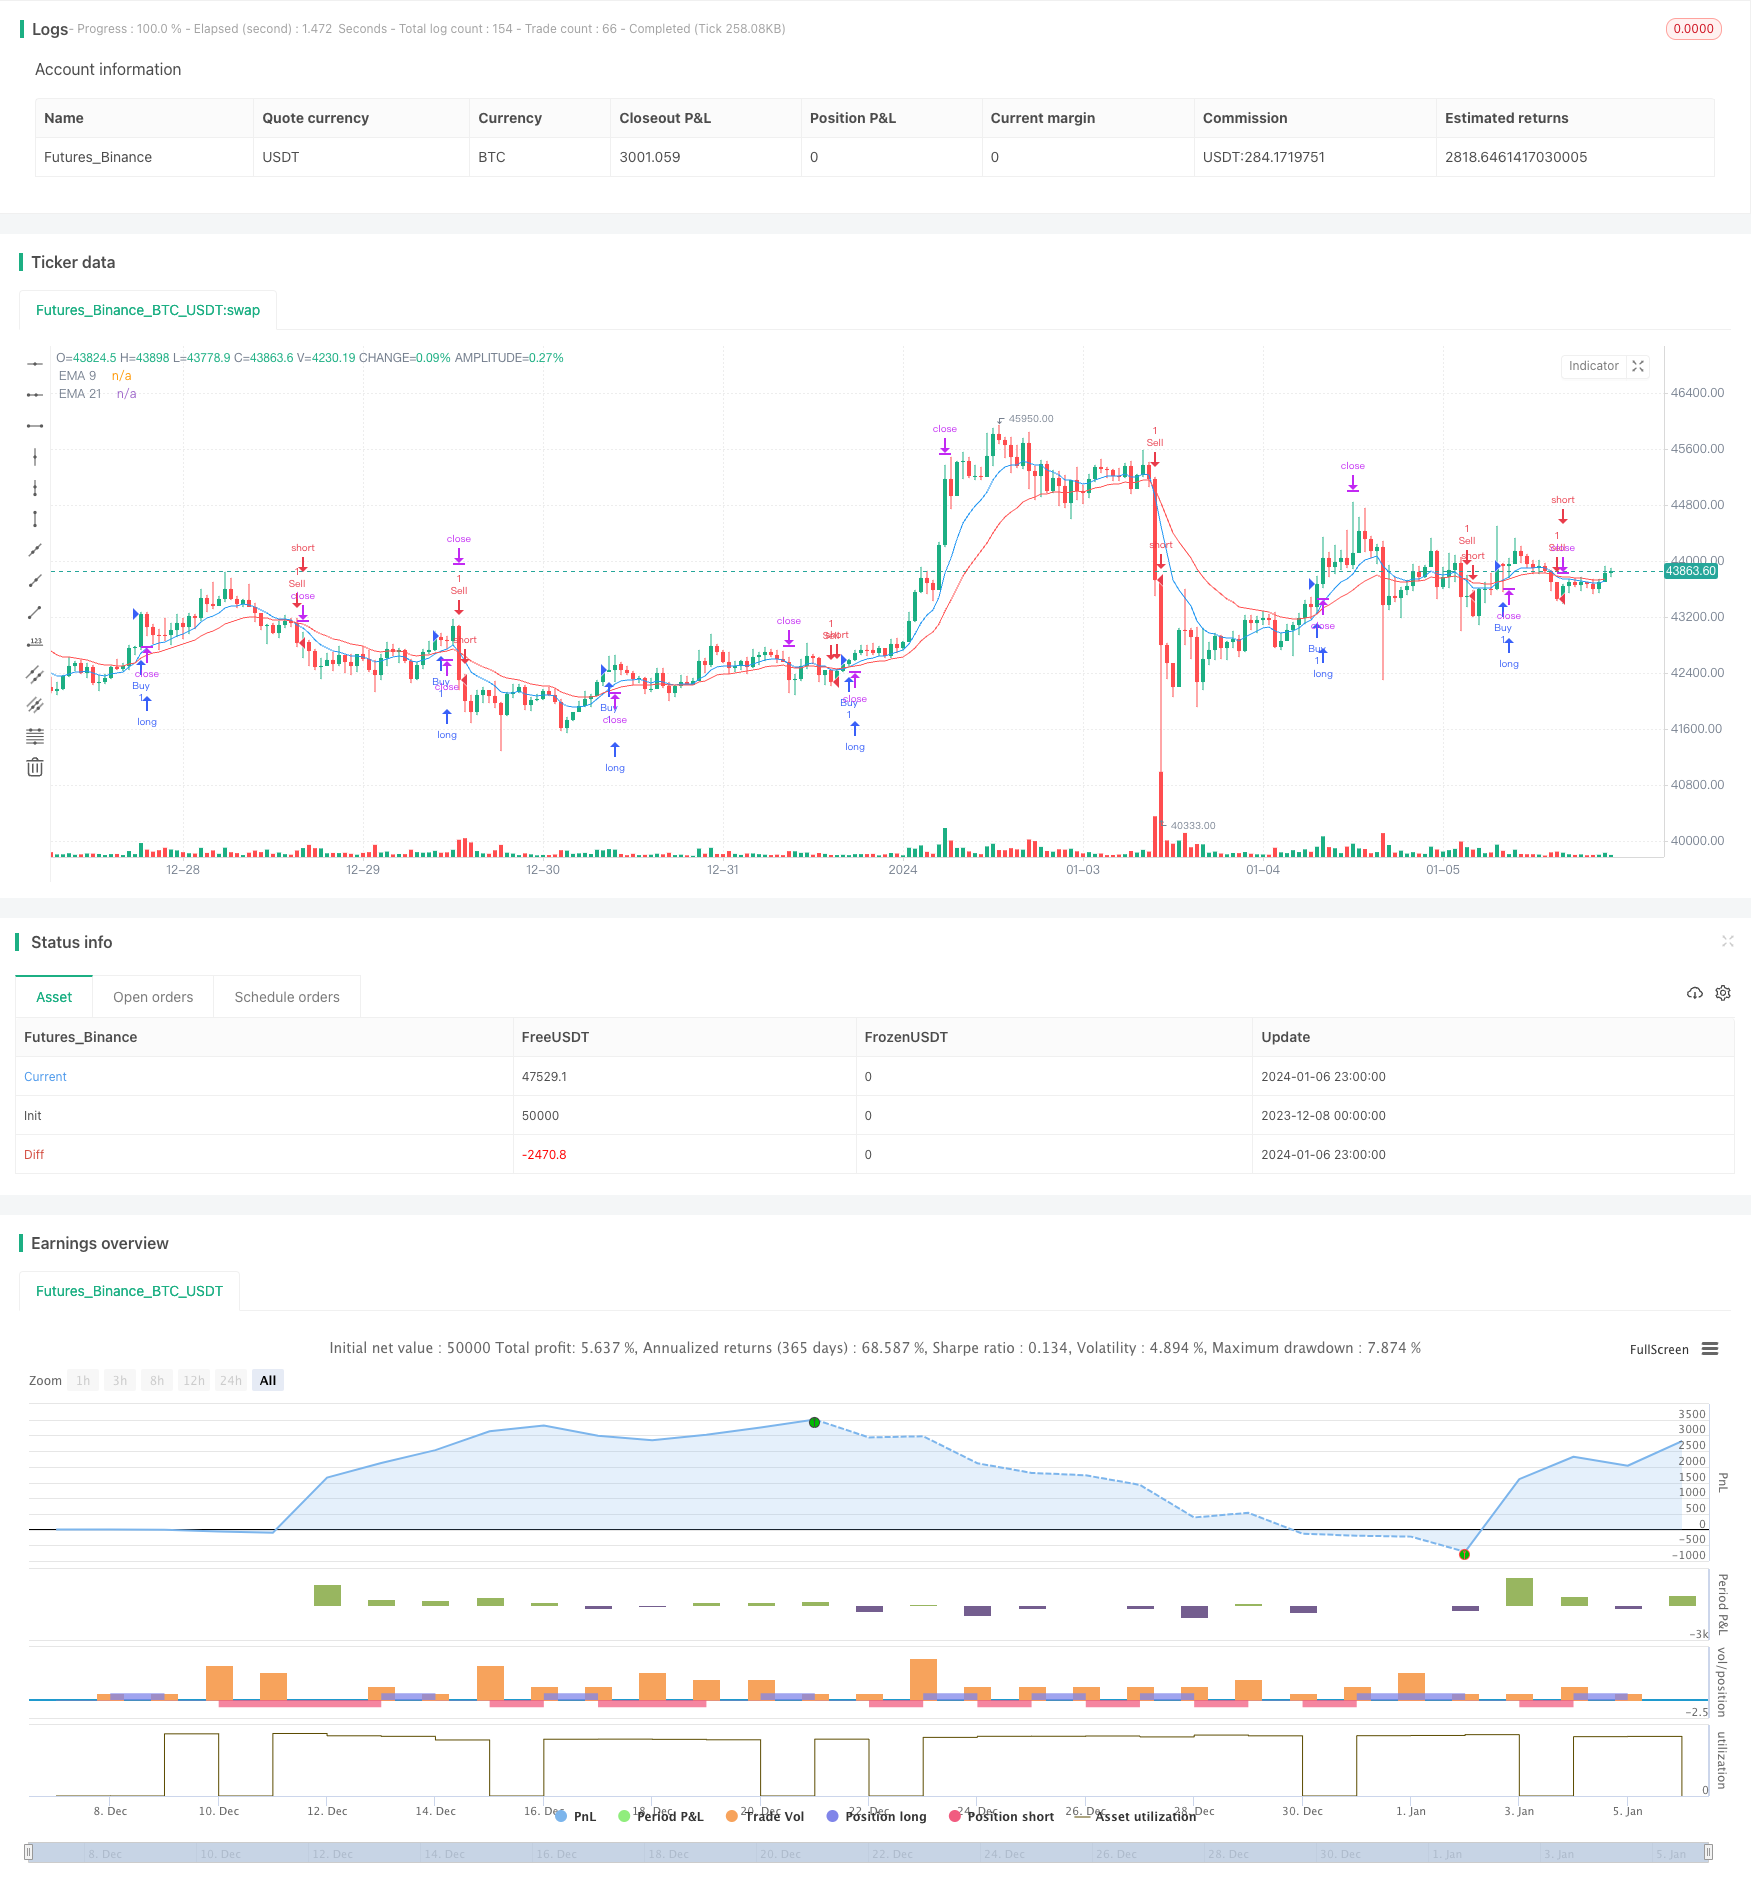
start: 2023-12-08 00:00:00
end: 2024-01-07 00:00:00
period: 1h
basePeriod: 15m
exchanges: [{"eid":"Futures_Binance","currency":"BTC_USDT"}]
*/

//@version=5
strategy("EMA Crossover and Close Above/Below EMA 21", overlay=true)

// Define the EMA lengths
ema9 = ta.ema(close, 9)
ema21 = ta.ema(close, 21)

// Define Buy and Sell conditions
buyCondition = ta.crossover(ema9, ema21) and close > ema21
sellCondition = ta.crossunder(ema9, ema21) and close < ema21

// Calculate stop loss and take profit levels (adjust as needed)
stopLossPct = input.float(1, title="Stop Loss (%)") / 100
takeProfitPct = input.float(2, title="Take Profit (%)") / 100

stopLoss = close * (1 - stopLossPct)
takeProfit = close * (1 + takeProfitPct)

// Plot EMA lines
plot(ema9, color=color.blue, title="EMA 9")
plot(ema21, color=color.red, title="EMA 21")

// Strategy entry and exit
if buyCondition
    strategy.entry("Buy", strategy.long)

if sellCondition
    strategy.entry("Sell", strategy.short)

strategy.exit("Take Profit/Stop Loss", from_entry="Buy", stop=stopLoss, limit=takeProfit)


More