概述
双重均线震荡突破策略是一种运用双重均线系统的短线交易策略。该策略基于价格通道和双重布林带构建交易信号,辅以快速RSI指标判断超买超卖,从而产生入场和出场信号。该策略旨在捕捉中短线价格趋势的突破,实现盈利。
策略原理
双重均线震荡突破策略使用长度为20周期的价格通道和布林带作为主要交易指标。价格通道是由最高价和最低价的均线构成,代表了当前价格的震荡区间。布林带则由价格通道中轴和标准差构成,带状区域更直观地描述了价格的波动范围。当价格接近通道上下轨时,表示价格可能突破震荡区间,形成新的趋势。此时,结合快速RSI指标判断是否超买超卖,可以判断趋势方向并作出交易决策。
具体来说,当快速RSI低于5时视为超卖区,当快速RSI超过99时视为超买区。此外,还要结合K线实体方向、价格创新高(新低)等因素判断,避免出现头部假突破的情况。当上述条件满足时产生买入和卖出信号。
策略优势
双重均线震荡突破策略最大的优势是捕捉中短线价格趋势的转折点,实现盈利。相比单一均线和通道,双重布林带更能直观反映价格波动和容量。而相比更长周期指标,如20日、60日均线等,它对价格变化的响应更加迅速,捕捉转折的成功率更高。此外,结合快速RSI指标可以有效过滤假突破。所以,该策略可以最大限度地提高获利概率。
策略风险
双重均线震荡突破策略存在一定的风险。首先,中短线交易本身就具有更高的止损风险。强势趋势行情中,中短线指标可能出现多次头部假突破从而造成止损。其次,快速RSI指标对超买超卖判断的效果会受到市场情绪的影响。在市场发生结构性变化时,这类辅助指标的效用会降低。最后,结合其他因素如收盘价、量能、成交量可以提高决策的准确性。
对策是适当调整止损幅度,宽松在上行行情中止损点,缩紧在下行行情中。此外,充分考量更多辅助指标,避免单一依赖某一二指标。当判断效果降低时,适当减小仓位规避风险。
策略优化方向
双重均线震荡突破策略还有进一步优化的空间。第一,参数优化。可以测试更多周期参数,找到最优参数组合。第二,模型优化。引入机器学习模型训练判断超买超卖区位更准确。第三,时间框架优化。分别在日线、60分钟等不同时间框架下测试,确定最佳适用场景。第四,条件优化。加入更多量价指标判断过滤信号,如成交量放大、趋势指数DMI等。
总结
双重均线震荡突破策略通过构建双重布林带系统捕捉价格中短线突破,是一种有效的趋势追踪策略。该策略成功率高、响应迅速,能够有效盈利。通过参数优化、模型优化、时间框架选择等手段,可以进一步提升策略表现。该策略适用于有经验的量化交易者进行定量化改进和应用。
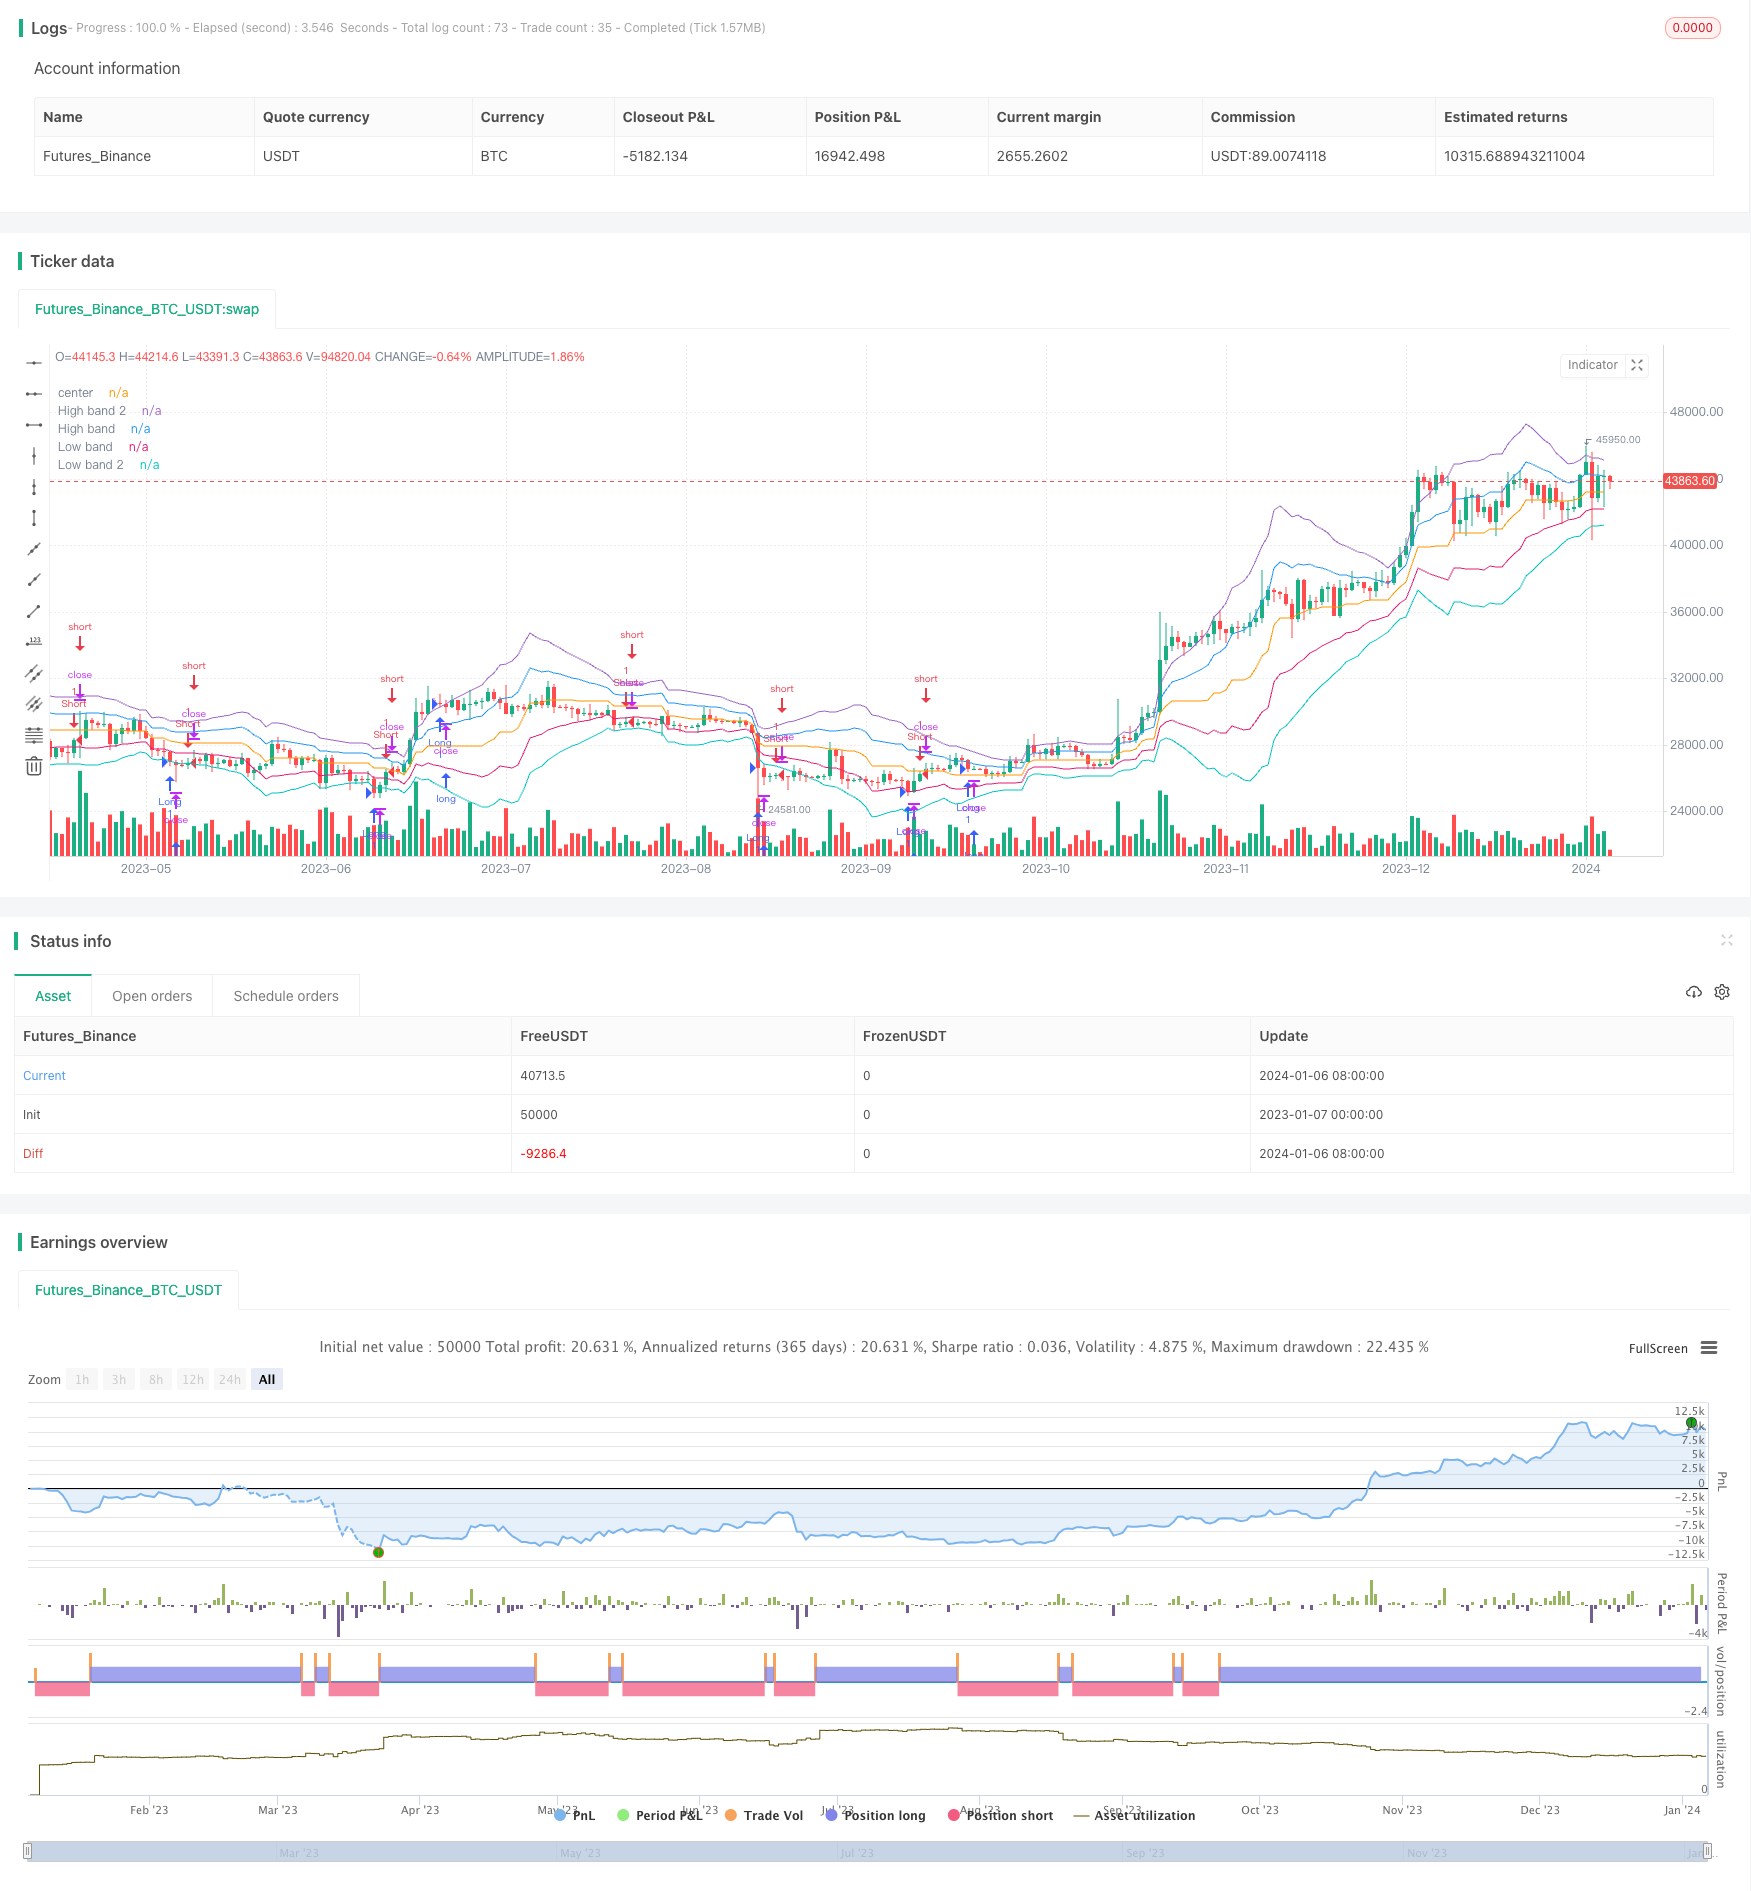
/*backtest
start: 2023-01-07 00:00:00
end: 2024-01-07 00:00:00
period: 1d
basePeriod: 1h
exchanges: [{"eid":"Futures_Binance","currency":"BTC_USDT"}]
*/


//@version=2
strategy("Noro's Bands Strategy v1.4", shorttitle = "NoroBands str 1.4", overlay=true, default_qty_type = strategy.percent_of_equity, default_qty_value=100.0, pyramiding=0)

//Settings
needlong = input(true, defval = true, title = "Long")
needshort = input(true, defval = true, title = "Short")
len = input(20, defval = 20, minval = 2, maxval = 200, title = "Period")
color = input(true, "Use ColorBar")
usecb = input(true, "Use CryptoBottom")
usersi = input(true, "Use RSI")
usemm = input(true, "Use min/max")
needbb = input(false, defval = false, title = "Show Bands")
needbg = input(false, defval = false, title = "Show Background")
needlo = input(false, defval = false, title = "Show Locomotive")
src = close

//Fast RSI
fastup = rma(max(change(src), 0), 2)
fastdown = rma(-min(change(src), 0), 2)
fastrsi = fastdown == 0 ? 100 : fastup == 0 ? 0 : 100 - (100 / (1 + fastup / fastdown))

//CryptoBottom
mac = sma(close, 10)
lencb = abs(close - mac)
sma = sma(lencb, 100)
max = max(open, close)
min = min(open, close)

//PriceChannel
lasthigh = highest(src, len)
lastlow = lowest(src, len)
center = (lasthigh + lastlow) / 2

//dist
dist = abs(src - center)
distsma = sma(dist, len)
hd = center + distsma
ld = center - distsma
hd2 = center + distsma * 2
ld2 = center - distsma * 2

//Trend
trend = close < ld and high < hd ? -1 : close > hd and low > ld ? 1 : trend[1]

//Lines
colo = needbb == false ? na : black
plot(hd2, color = colo, linewidth = 1, transp = 0, title = "High band 2")
plot(hd, color = colo, linewidth = 1, transp = 0, title = "High band")
plot(center, color = colo, linewidth = 1, transp = 0, title = "center")
plot(ld, color = colo, linewidth = 1, transp = 0, title = "Low band")
plot(ld2, color = colo, linewidth = 1, transp = 0, title = "Low band 2")

//Background
col = needbg == false ? na : trend == 1 ? lime : red
bgcolor(col, transp = 80)

//Signals
up = trend == 1 and ((close < open or color == false) or close < hd) and (min < min[1] or usemm == false) ? 1 : 0
dn = trend == -1 and ((close > open or color == false) or close > ld) and (max > max[1] or usemm == false) ? 1 : 0
up2 = close < open and lencb > sma * 3 and min < min[1] and fastrsi < 10 ? 1 : 0 //CryptoBottom
//dn2 = close > open and len > sma * 3 and max > max[1] and fastrsi > 90 ? 1 : 0 //CryptoBottom
up3 = fastrsi < 5 ? 1 : 0
//dn3 = fastrsi > 99 ? 1 : 0

//Locomotive
uploco = trend == 1 and close < open and min < min[1] and close < center ? 1 : 0
plotarrow(needlo == true and uploco == 1 ? 1 : 0, colorup = black, colordown = black, transp = 0)

longCondition = up == 1 or (up2 == 1 and usecb == true) or (up3 == 1 and usersi == true)
if (longCondition)
    strategy.entry("Long", strategy.long, needlong == false ? 0 : na)

shortCondition = dn == 1
if (shortCondition)
    strategy.entry("Short", strategy.short, needshort == false ? 0 : na)