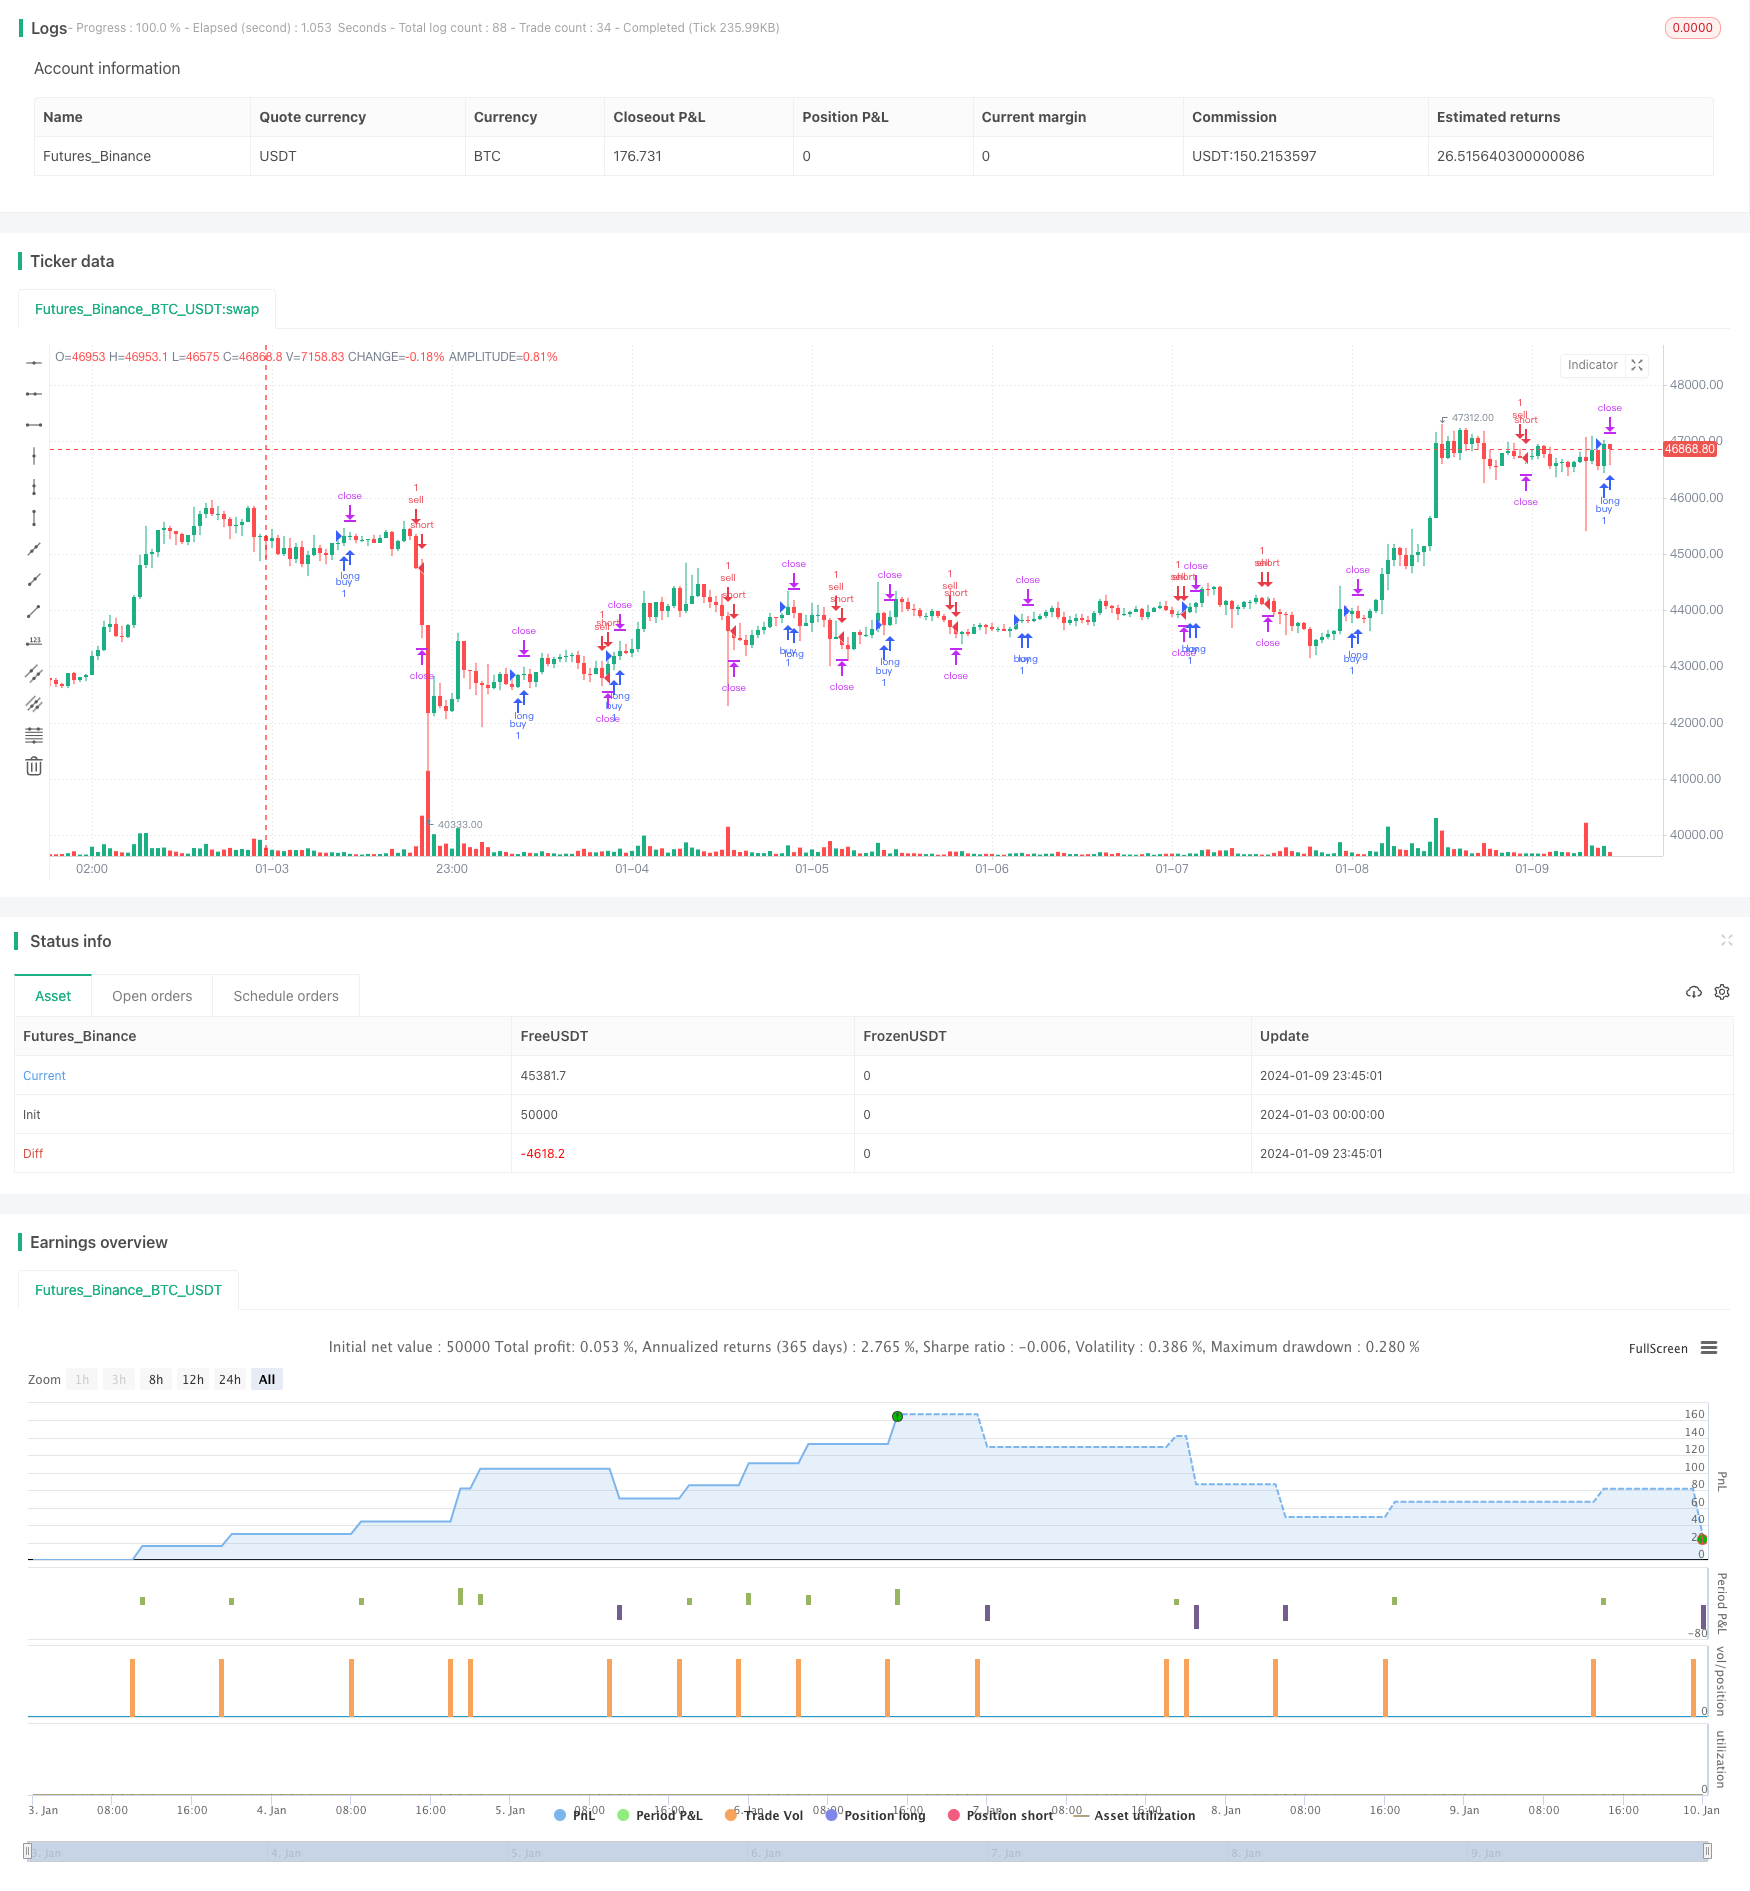
概述
该策略的核心思想是利用EMA和WMA的交叉作为入场信号,并结合基于点数计算的止损止盈来进行交易。其最大的优势在于可以非常灵活和精确的控制风险,通过调整点数大小来控制止损止盈的幅度。
策略原理
当EMA由下向上突破WMA时产生做多信号;当EMA由上向下跌破WMA时,产生做空信号。进入仓位后,会实时计算入场点位,并在此基础上设置止损和止盈。例如设置止损20点,止盈100点,那么具体的止损价位会是入场价减去20点*合约价值,止盈价位是入场价加上100点*合约价值。这样来控制风险和盈利。
同时,策略还会结合当前盘口与历史止损进行比较,调整移动止损位置,实现流动止损追价。
优势分析
相比普通的固定点数或百分比止损,该策略最大的优势在于可以非常灵活和精确的控制风险。调整点数的大小就可以直接影响到止损幅度的大小。这对于不同品种非常适用,可以根据市场的波动频率和幅度来微调。
另外,流动止损也是一个非常实用的功能。它可以根据行情的实时变化来跟踪调整止损位置,在保证风险控制的同时,可以尽可能追求更大的盈利。
风险分析
该策略的风险主要来自于EMA和WMA这两个指标本身。当行情出现剧烈变动时,它们常常会发出错误信号,容易止损。这时,建议适当放宽止损点数,或考虑替换其他指标组合。
另一个风险点在于止损止盈难以同时兼顾。如果追求更高止盈,通常需要承担更大风险,这很容易在行情转向时止损。所以,止损止盈的设置需要仔细测试和评估。
优化方向
该策略可以从以下几个方向进行优化:
- 测试不同参数的EMA和WMA组合,找到最佳参数;
- 尝试其他指标如MACD、KDJ等替换或结合,看是否可以提高胜率;
- 评估不同止损止盈点数的风险收益情况,找到最优配置;
- 研究不同品种的特点,调整参数适应不同市场; 5.加入机器学习算法,实现参数的动态优化。
总结
该策略核心思路简单清晰,以EMA和WMA指标为基础,运用基于点数计算的止损止盈机制进行风险控制。策略优势在于风险控制精确灵活,可按不同市场适当调整。后续可从入场信号、参数选择、止损机制等方面进行深度优化,使策略更适应复杂多变的市场环境。
策略源码
/*backtest
start: 2024-01-03 00:00:00
end: 2024-01-10 00:00:00
period: 45m
basePeriod: 5m
exchanges: [{"eid":"Futures_Binance","currency":"BTC_USDT"}]
*/

// inspiration script from: @ahmad_naquib
// inspiration script link: https://www.tradingview.com/script/tGTV8MkY-Two-Take-Profits-and-Two-Stop-Loss/
// inspiration strategy script name: Two Take Profits and Two Stop Loss


////////////
// Do not use this strategy, it's just an exmaple !! The goal from this script is to show you TP and SL based on PIPS
////////////


//@version=5
strategy('SL & TP based on Pips', "PIP SL & TP", overlay=true, initial_capital=1000)

// MA
ema_period = input(title='EMA period', defval=10)
wma_period = input(title='WMA period', defval=20)
ema = ta.ema(close, ema_period)
wma = ta.wma(close, wma_period)

// Entry Conditions
long = ta.crossover(ema, wma) and nz(strategy.position_size) == 0
short = ta.crossunder(ema, wma) and nz(strategy.position_size) == 0

// Pips Calculation
pip1 = input(20, title = "TP PIP", group = "PIP CALCULATION") * 10 * syminfo.mintick
pip2 = input(20, title = "SL PIP", group = "PIP CALCULATION") * 10 * syminfo.mintick

// Trading parameters
var bool LS = na
var bool SS = na

var float EP = na // Entry Position
var float TVL = na
var float TVS = na
var float TSL = na
var float TSS = na

var float TP1 = na
//var float TP2 = na
var float SL1 = na
///var float SL2 = na

// SL & TP Values
// there's also SL2 and TP2 in case you want to add them to your script,
//also you can add a break event in the strategy.entry section.

if short or long and strategy.position_size == 0
    EP := close
    SL1 := EP - pip2 * (short ? -1 : 1)
    //SL2 := EP - pip2 * (short ? -1 : 1)

    TP1 := EP + pip1 * (short ? -1 : 1)
    //TP2 := EP + pip1 * 2 * (short ? -1 : 1)


// current trade direction
LS := long or strategy.position_size > 0
SS := short or strategy.position_size < 0

// adjust trade parameters and trailing stop calculations
TVL := math.max(TP1, open) - pip1[1]
TVS := math.min(TP1, open) + pip1[1]
TSL := open[1] > TSL[1] ? math.max(TVL, TSL[1]) : TVL
TSS := open[1] < TSS[1] ? math.min(TVS, TSS[1]) : TVS

//if LS and high > TP1
    //if open <= TP1
        //SL2 := math.min(EP, TSL)

//if SS and low < TP1
    //if open >= TP1
        //SL2 := math.max(EP, TSS)


// Closing conditions
// and those are a closing conditions in case you want to add them.

//close_long = LS and open < SL2
//close_short = SS and open > SL2

// Buy
if (long and not SS)
    strategy.entry('buy', strategy.long)
strategy.exit('exit1', from_entry='buy', stop=SL1, limit=TP1, qty_percent=100)
//strategy.exit('exit2', from_entry='buy', stop=SL2, limit=TP2)

// Sell
if (short and not LS)
    strategy.entry('sell', strategy.short)
strategy.exit('exit3', from_entry='sell', stop=SL1, limit=TP1, qty_percent=100)
//strategy.exit('exit4', from_entry='sell', stop=SL2, limit=TP2)

// Plots
// those are plots for the lines of The tp and sl. they are really useful, and in the next update I will use a filling option.

a = plot(strategy.position_size > 0 ? SL1 : na, color=color.new(#af0829, 30), linewidth = 2, style=plot.style_linebr)
b = plot(strategy.position_size < 0 ? SL1 : na, color=color.new(#af0829, 30), linewidth = 2, style=plot.style_linebr)

c = plot(strategy.position_size > 0 ? TP1 : na, color=color.new(#2e7e00, 30), linewidth = 2, style=plot.style_linebr)
d = plot(strategy.position_size < 0 ? TP1 : na, color=color.new(#2e7e00, 30), linewidth = 2, style=plot.style_linebr)

g = plot(strategy.position_size >= 0 ? na : EP, color=color.new(#ffffff, 50), style=plot.style_linebr)
h = plot(strategy.position_size <= 0 ? na : EP, color=color.new(#ffffff, 50), style=plot.style_linebr)


// those are plot for the TP2 and SL2, they are optional if you want to add them.

//e = plot(strategy.position_size > 0 ? TP2 : na, color=color.new(#00ced1, 0), style=plot.style_linebr)
//f = plot(strategy.position_size < 0 ? TP2 : na, color=color.new(#00ced1, 0), style=plot.style_linebr)


//those are the plot for the ema and wma strategy for short and long signal. they are not really a good strategy, I just used them as an example
//but you have the option to plot them or not.
// do not use this strategy, it's just an exmaple !! The goal from this script is to show you TP and SL based on PIPS

//plot(ema, title='ema', color=color.new(#fff176, 0))
//plot(wma, title='wma', color=color.new(#00ced1, 0))