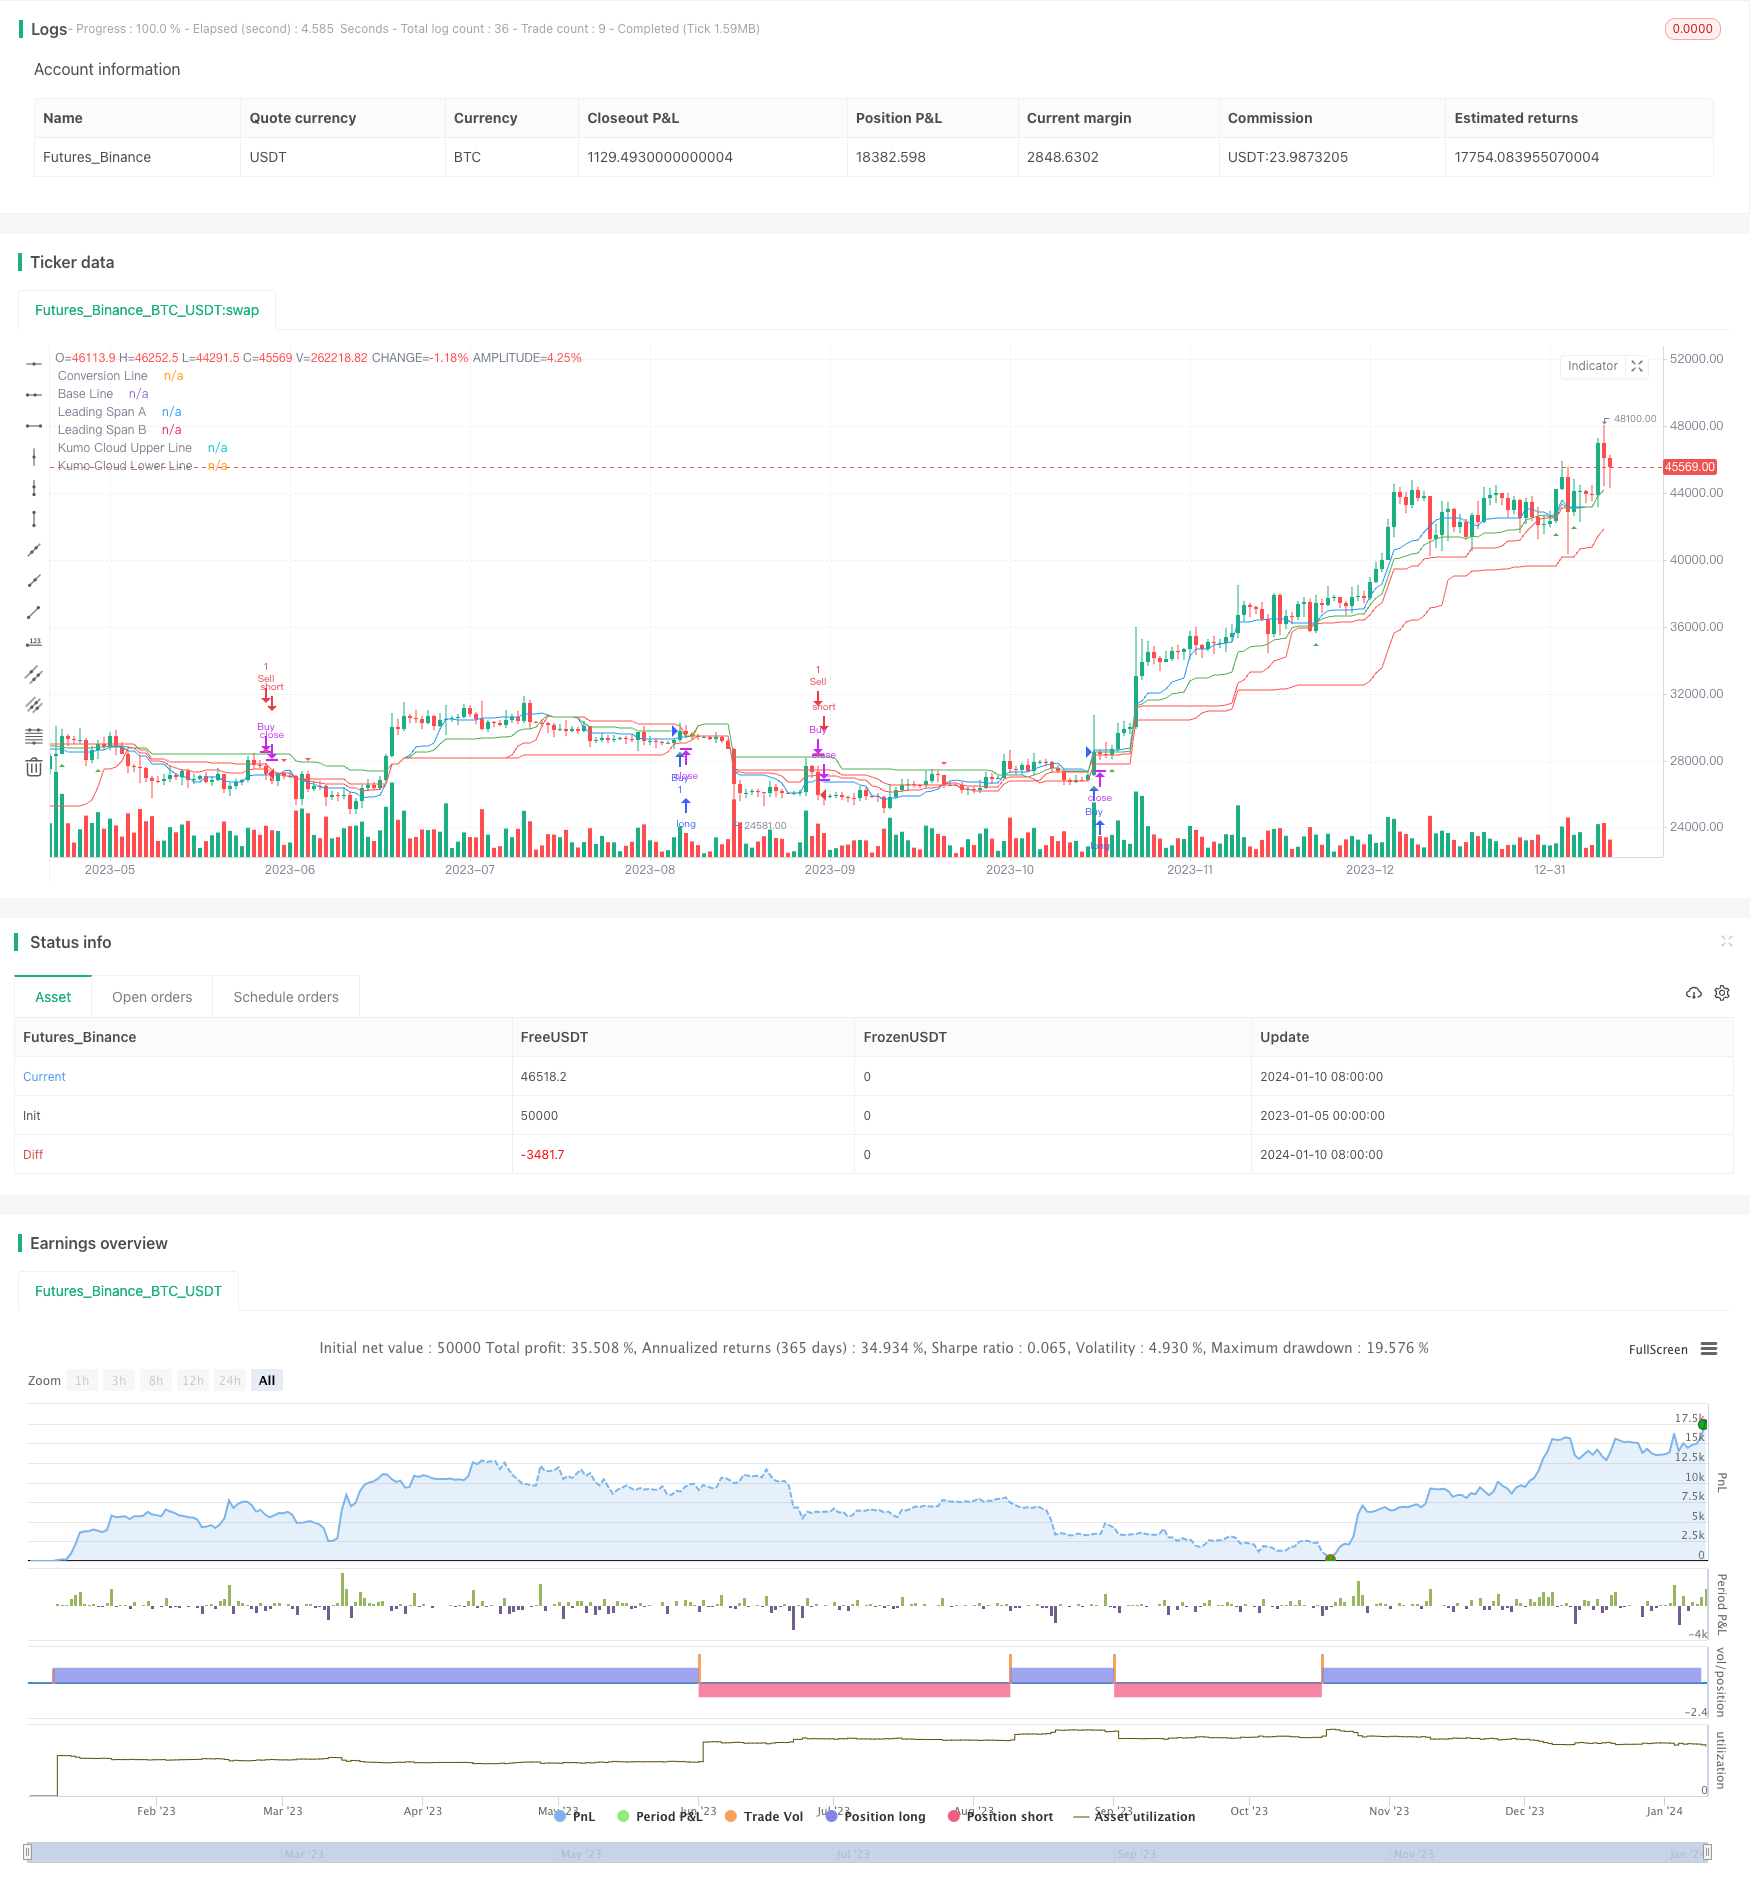
概述
本策略基于Ichimoku云图指标设计了一个量化交易系统,主要用于具有良好趋势的资产。该策略融合了停损、止损、追踪止损等功能,旨在实现稳定的盈利。
策略原理
Ichimoku云图由转換线、基准线、前沿线1、前沿线2和云图组成。本策略的交易信号来自于价格与云图的关系。具体来说,当价格上穿前沿线1时产生买入信号;当价格下穿前沿线1时产生卖出信号。此外,前沿线2也会作为辅助判断指标。
本策略还设定了基于ATR指标的止损位和止盈位。ATR指标可以有效地捕捉市场的波动程度。止损位为ATR的2倍,止盈位为ATR的4倍。这可以有效控制单笔损失并锁定部分利润。
最后,本策略采用了追踪止损机制。具体来说,对于做多单,会以ATR的2倍作为后撤位,实时调整止损线以锁定利润;对于做空单,会以ATR的2倍作为后撤位,实时调整止损线以锁定利润。
策略优势分析
- 基于Ichimoku云图指标,可以有效捕捉趋势
- 结合ATR指标进行止损止盈,可以控制风险
- 采用追踪止损机制,可以很好地锁定利润
- 策略逻辑简单清晰,容易理解和验证
- 可 parametrization,根据不同市场调整参数
风险分析
- Ichimoku云图对Paramer设置比较敏感,不恰当的设置可能错过交易机会或者产生错误信号
- 追踪止损如果设置的幅度过大,可能会过早止损
- 强势股可能会突破ATR指标给出的止损线或者追踪止损线
- 交易成本也会对盈利能力产生一定影响
对应风险的解决方法: 1. 对Ichimoku云图的参数进行优化,找到最适合的设置 2. 评估合理的追踪止损幅度,不能过大也不能过小 3. 对强势股票可以适当放宽止损范围 4. 选择具有低廉手续费的券商
策略优化方向
- 结合其他技术指标进行信号过滤,减少错误交易
- 基于历史数据/回测对参数进行优化
- 不同品种参数设置可以进行分别优化
- 可以考虑动态调整止损幅度
- 结合算法进行特征工程,建立更可靠的交易信号
总结
本策略总体来说是一个稳定的趋势跟踪策略。基于Ichimoku云图指标判断趋势方向;利用ATR指标设定止损止盈;采用追踪止损锁定利润。优点是逻辑简洁,容易理解;可以控制单笔损失;可以有效跟踪趋势。但也存在一些参数设置敏感以及止损被突破的风险。通过不断优化参数以及策略本身,可以获得更好的表现。
策略源码
/*backtest
start: 2023-01-05 00:00:00
end: 2024-01-11 00:00:00
period: 1d
basePeriod: 1h
exchanges: [{"eid":"Futures_Binance","currency":"BTC_USDT"}]
*/

//@version=5
strategy("Ichimoku Cloud Strategy with SL, TP, and Trailing Stop", overlay=true)

conversionPeriods = input(9, "Conversion Line Length")
basePeriods = input(26, "Base Line Length")
laggingSpan2Periods = input(52, "Leading Span B Length")
displacement = input(26, "Lagging Span")
atrLength = input(14, title="ATR Length")

donchian(len) => math.avg(ta.lowest(len), ta.highest(len))
conversionLine = donchian(conversionPeriods)
baseLine = donchian(basePeriods)
leadLine1 = math.avg(conversionLine, baseLine)
leadLine2 = donchian(laggingSpan2Periods)

// Plot the Ichimoku Cloud components
plot(conversionLine, color=color.blue, title="Conversion Line")
plot(baseLine, color=color.red, title="Base Line")
plot(leadLine1, color=color.green, title="Leading Span A")
plot(leadLine2, color=color.orange, title="Leading Span B")
plot(leadLine1 > leadLine2 ? leadLine1 : leadLine2, color=color.green, title="Kumo Cloud Upper Line")
plot(leadLine1 < leadLine2 ? leadLine1 : leadLine2, color=color.red, title="Kumo Cloud Lower Line")

// ATR for stop loss and take profit
atrValue = ta.atr(atrLength)
stopLoss = atrValue * 2
takeProfit = atrValue * 4

// Strategy entry and exit conditions
longCondition = ta.crossover(close, leadLine1) and close > leadLine2
shortCondition = ta.crossunder(close, leadLine1) and close < leadLine2

// Plot buy and sell signals
plotshape(series=longCondition ? leadLine1 : na, title="Buy Signal", location=location.belowbar, color=color.green, style=shape.triangleup, size=size.small)
plotshape(series=shortCondition ? leadLine1 : na, title="Sell Signal", location=location.abovebar, color=color.red, style=shape.triangledown, size=size.small)

// Execute strategy orders with stop loss and take profit
strategy.entry("Buy", strategy.long, when=longCondition)
strategy.close("Buy", when=shortCondition) // Close buy position when sell condition is met
strategy.entry("Sell", strategy.short, when=shortCondition)
strategy.close("Sell", when=longCondition) // Close sell position when buy condition is met

// Trailing stop
strategy.cancel("Trailing Stop")
var float trailingStopPrice = na
if (longCondition)
    trailingStopPrice := math.max(trailingStopPrice, close - atrValue * 2)
    strategy.exit("Trailing Stop", from_entry="Buy", trail_offset=atrValue * 2, trail_price=trailingStopPrice)
else if (shortCondition)
    trailingStopPrice := math.min(trailingStopPrice, close + atrValue * 2)
    strategy.exit("Trailing Stop", from_entry="Sell", trail_offset=atrValue * 2, trail_price=trailingStopPrice)