概述
本策略通过添加一个基于历史波动率的过滤器,实现了一个改进版的买入并持有策略。过滤器的作用是在市场波动性较高的时期关闭买入头寸,而在波动性较低时重新建立买入头寸,从而降低策略的最大回撤。
策略原理
- 计算SPY在过去100天内的历史波动率
- 如果当前波动率高于过去100天波动率的95分位值,则过滤该交易日,关闭买入头寸
- 如果波动率低于95分位值,则建立买入头寸
优势分析
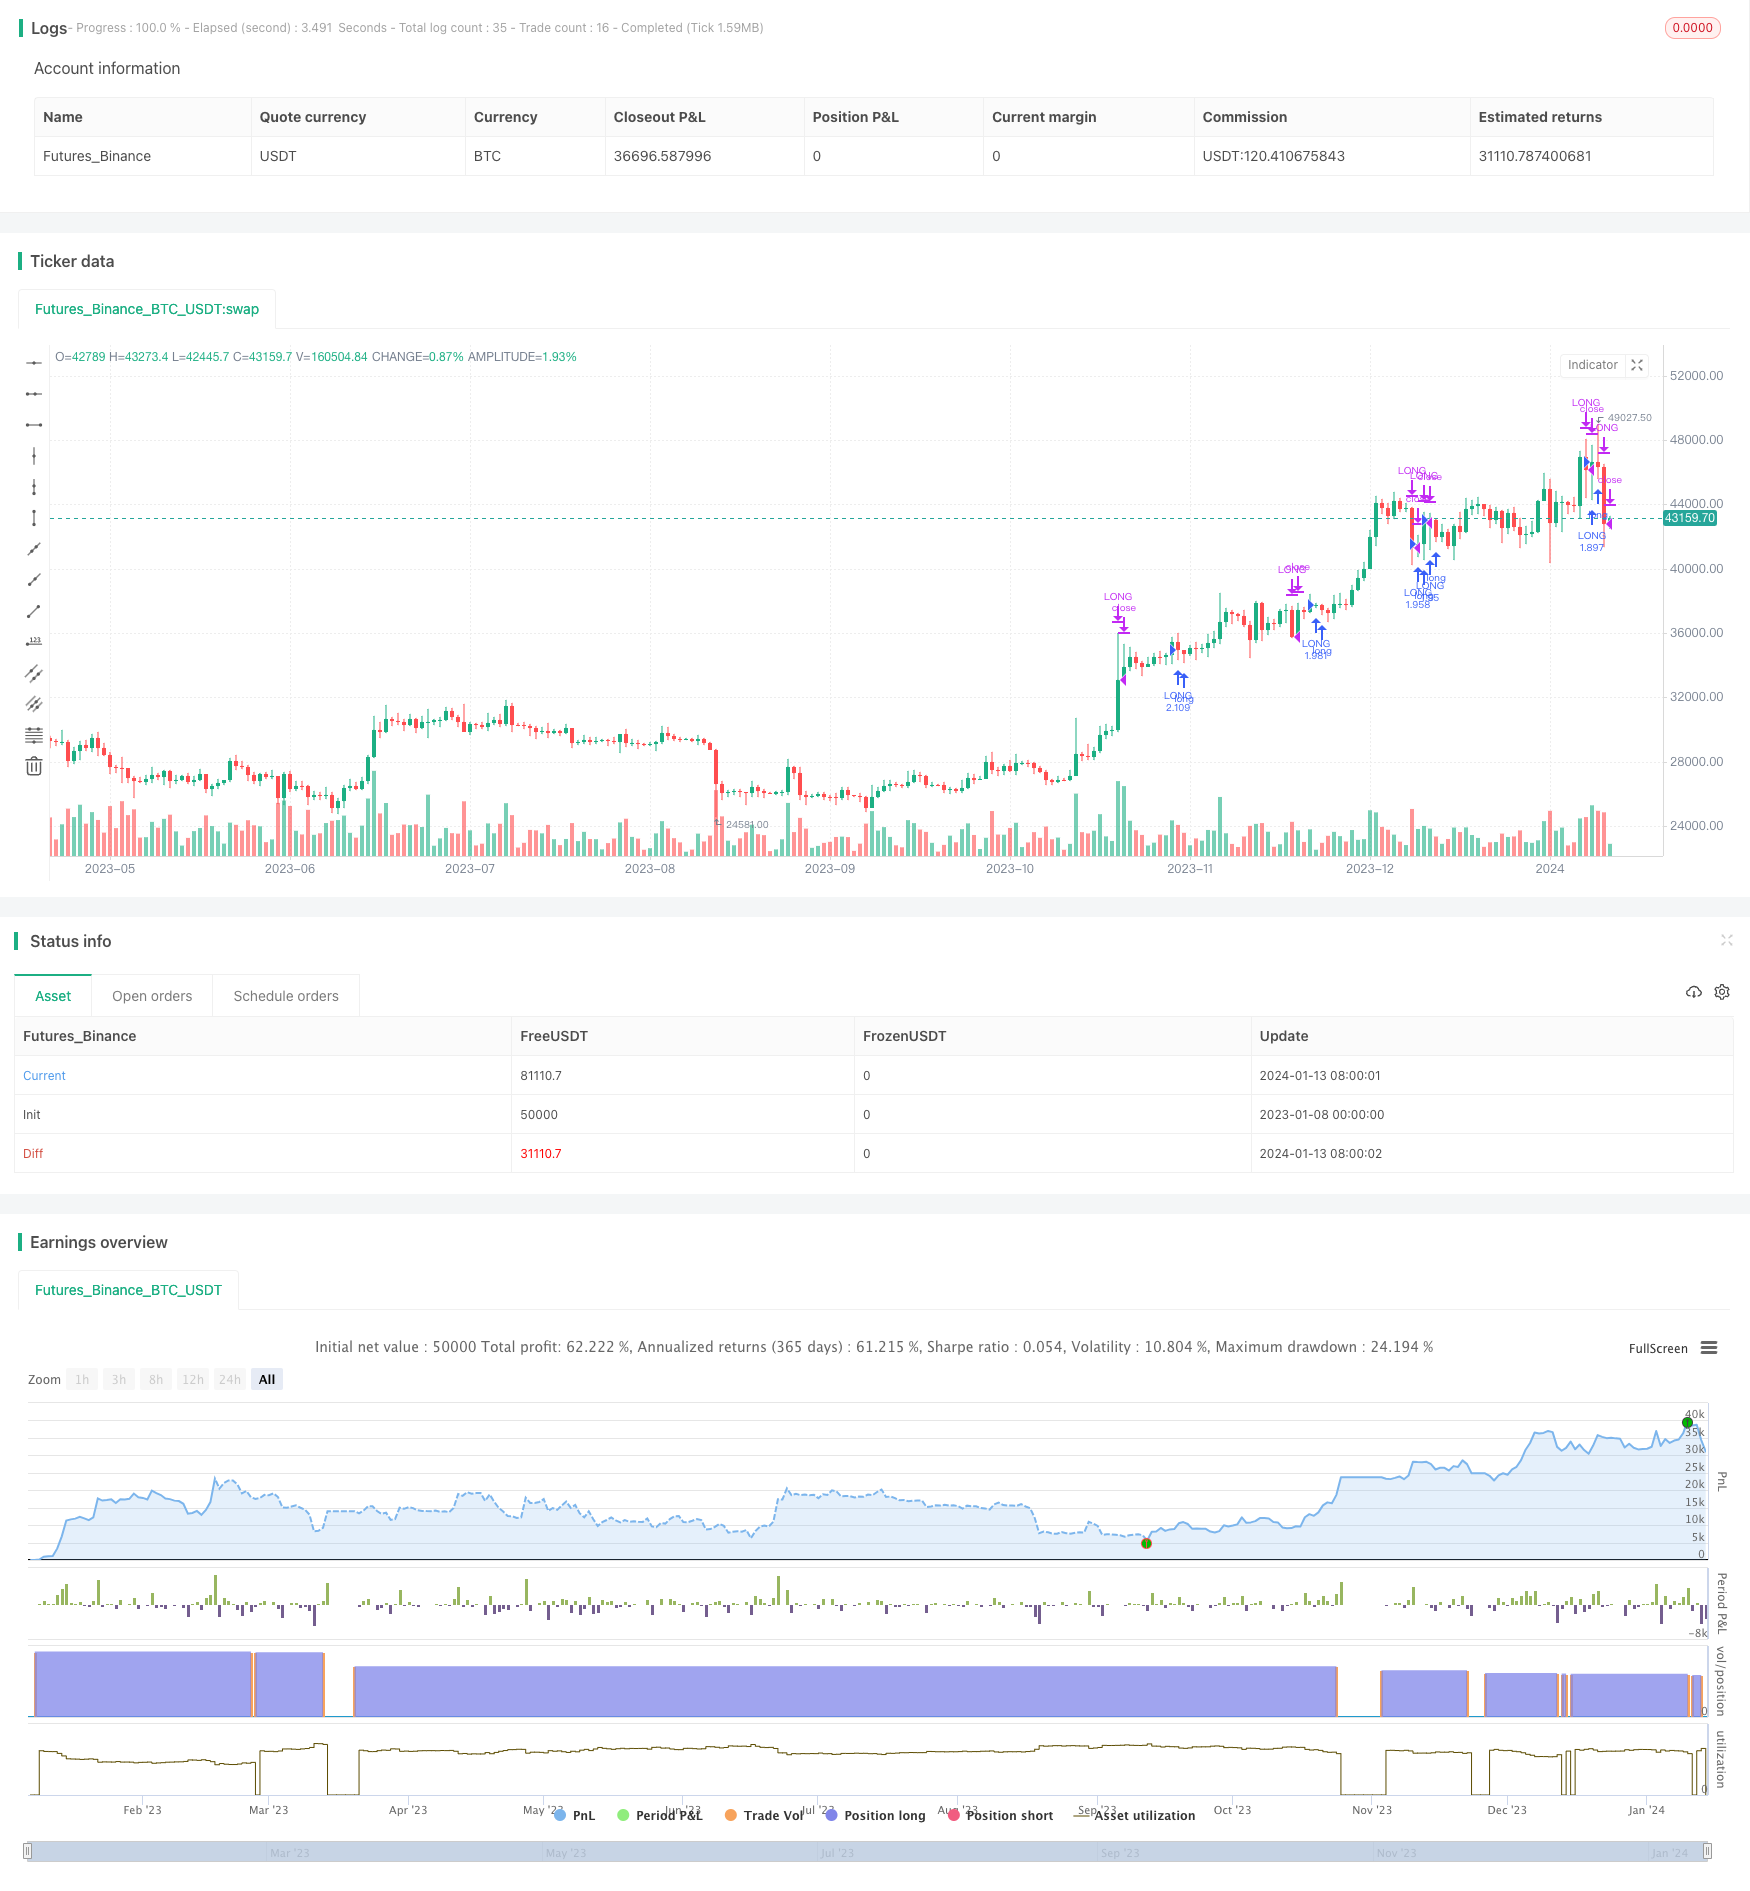
相比于无过滤器的简单买入并持有策略,本策略在28年的回测期内,年化收益率有所提高(7.95% vs 9.92%),同时最大回撤大幅下降(50.79% vs 31.57%)。这说明加入市场波动性过滤器可以在一定程度上提高策略收益率并减少风险。
风险分析
本策略的主要风险在于波动率计算方法和过滤器参数设置的准确性。如果波动率计算不准确,过滤器将失效;如果过滤器参数设置的太保守或者太激进,都会对策略收益产生不利影响。此外,Past performance is not indicative of future results,策略的历史表现不代表未来表现。
优化方向
可以考虑加入其他过滤器 Indicators 作为确认信号,比如长期移动均线,大盘指数ADX指标等。另外参数调整优化也很关键,比如测试不同的 lookback period, filtering threshold 等参数设置。机器学习和时间序列分析技术也可以用来建立和优化波动率预测模型。
总结
本策略通过一个简单的基于历史波动率的过滤器,大幅提高了SPY买入持有策略的收益率,同时也显著降低了最大回撤。这证明了市场状态识别和资产配置的重要性。我们可以通过继续优化波动率模型和加入确认信号来进一步完善该策略。
策略源码
/*backtest
start: 2023-01-08 00:00:00
end: 2024-01-14 00:00:00
period: 1d
basePeriod: 1h
exchanges: [{"eid":"Futures_Binance","currency":"BTC_USDT"}]
*/

// This source code is subject to the terms of the Mozilla Public License 2.0 at https://mozilla.org/MPL/2.0/
//
// @author Sunil Halai
//
// This script has been created to demonstrate the effectiveness of using market regime filters in your trading strategy, and how they can improve your returns and lower your drawdowns
//
// This strategy adds a simple filter (The historical volatility filter, which can be found on my trading profile) to a traditional buy and hold strategy of the index SPY. There are other filters
// that could also be added included a long term moving average / percentile rank filter / ADX filter etc, to improve the returns further.
//
// The filter added closes our long position during periods of volatility that exceed the 95th percentile (or in the top 5% of volatile days)
//
// Have included the back test results since 1993 which is 28 years of data at the time of writing,  Comparing  buy and hold of the SPY (S&P 500), to improved by and hold offered here.
//
// Traditional buy and hold:
//
// Return per year:     7.95   % (ex Dividends)
// Total return :       851.1  %
// Max drawdown:        50.79  %
//
// 'Modified' buy and hold (this script):
//
// Return per year:     9.92    % (ex Dividends)
// Total return:        1412.16 %
// Max drawdown:        31.57   %
//
// Feel free to use some of the market filters in my trading profile to improve and refine your strategies further, or make a copy and play around with the code yourself. This is just
// a simple example for demo purposes.
//

//@version=4
strategy(title = "Simple way to beat the market [STRATEGY]", shorttitle = "Beat The Market [STRATEGY]", overlay=true, initial_capital=100000, default_qty_type=strategy.percent_of_equity, currency="USD", default_qty_value=100)


upperExtreme = input(title = "Upper percentile filter (Do not trade above this number)", type = input.integer, defval = 95)
lookbackPeriod = input(title = "Lookback period", type = input.integer, defval = 100)

annual = 365
per = timeframe.isintraday or timeframe.isdaily and timeframe.multiplier == 1 ? 1 : 7
hv = lookbackPeriod * stdev(log(close / close[1]), 10) * sqrt(annual / per)

filtered = hv >= percentile_nearest_rank(hv, 100, upperExtreme)

if(not(filtered))
    strategy.entry("LONG", strategy.long)
else
    strategy.close("LONG")