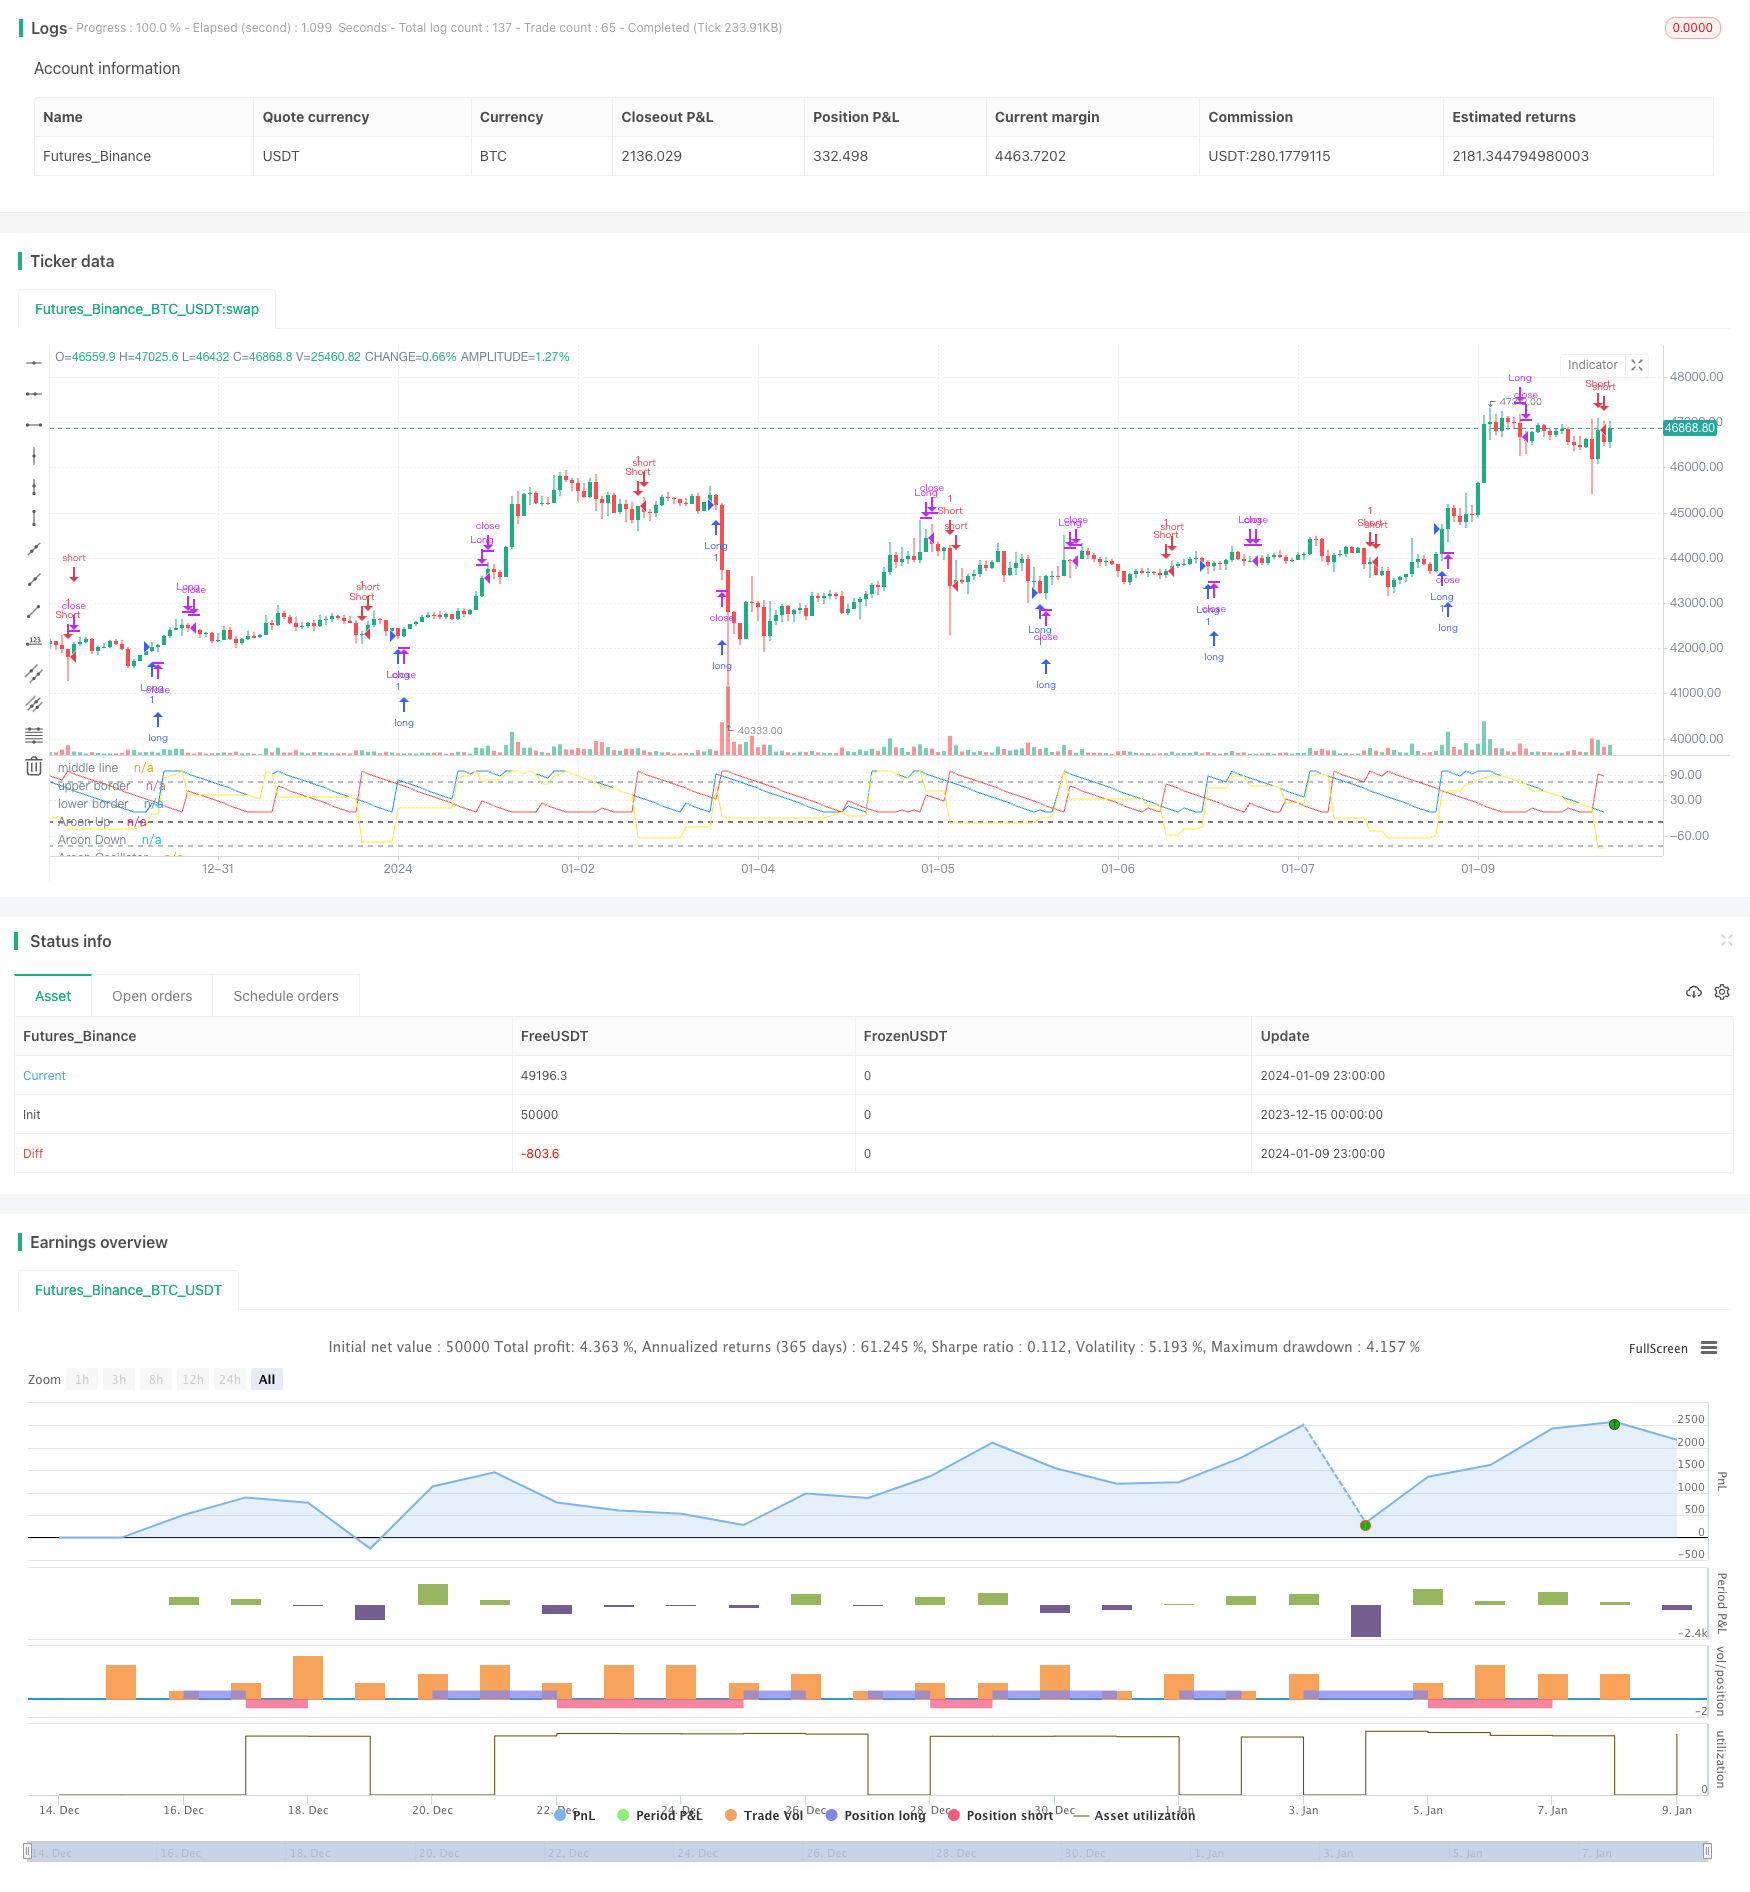
策略概述
本策略名为“Saucius 阿隆震荡器策略”,它适用于价格波动性较大、趋势不明显的股票、指数和大宗商品。策略使用阿隆震荡器指标识别价格趋势,结合多个参数设定入场和出场条件,实现对这类风险资产的自动交易。
策略原理
该策略源自阿隆线创始人Tushar Chande的思路。Chande认为,当阿隆震荡器高于或低于50时,可以识别出多头和空头趋势。这有助于弥补简单阿隆线和阿隆交叉在非趋势市场中的不足。
具体来说,策略首先计算长度为19周期的阿隆上线、阿隆下线和阿隆震荡器。震荡器由上线减去下线计算得到。然后设定中线为-25,上轨为75,下轨为-85。当天震荡器上穿中线时做多,下穿中线时做空。平仓条件为上穿上轨平多仓,下穿下轨平空仓。
这样,中线用于判断趋势方向进入场内,上下轨用于趋势反转退出场外,实现了基于阿隆震荡器指标的自动化交易。
策略优势
与传统趋势跟踪策略相比,本策略具有以下优势:
- 适用于波动较大、趋势不明显的品种,比简单趋势策略效果更好
- 使用阿隆震荡器判断趋势更可靠
- 多参数设定条件严谨,避免错误交易
- 获利快速,有效控制亏损风险
总的来说,该策略结合阿隆震荡器指标的优势,实现了对特定品种的自动化交易,胜率和盈利能力良好。
策略风险
本策略也存在一定的风险:
- 参数设置需要根据不同品种调整优化,否则会影响效果
- 交易频率可能较高,会增加交易成本和滑点成本
- 依赖技术指标,在指标失效时可能产生损失
这些风险点是可以通过调整参数、优化代码来改进和减小的。此外,合理的位置和资金管理也能有效控制潜在风险。
策略优化
为进一步提高策略效果,可以从以下几个方面进行优化:
- 调整参数,针对不同品种和市场环境进行测试
- 增加其他技术指标的组合,形成更强大的交易信号
- 增加止损策略,有效控制单笔亏损大小
- 结合量能指标,避免虚拟突破产生错误交易
- 优化入场条件,减少不必要的交易次数
通过多方位测试和优化,策略的稳定性、胜率和盈利能力还可以得到大幅提升。
总结
本策略基于阿隆震荡器指标创造性地实现了对波动性较大、趋势不明显品种的自动化交易。相比传统趋势策略,其在这类品种上效果更好,通过参数设定也实现了严谨的交易条件。策略优势显著,但也存在一定改进空间。通过针对性优化,效果还可得到进一步提高。该策略为量化交易实践提供了一个可参考的思路。
策略源码
/*backtest
start: 2023-12-15 00:00:00
end: 2024-01-10 00:00:00
period: 1h
basePeriod: 15m
exchanges: [{"eid":"Futures_Binance","currency":"BTC_USDT"}]
*/

//@version=2
// by Saucius Finance https://saucius-finance.blogspot.com/
// copyrights reserved :)
// This strategy derives form the consideration of the author, Tushar Chande, that, in "more patterns" paragraph,
// long and short trends are identified by oscillator < or > line 50.
// This helps because simple Aroon and Aroon crosses suffer in not trending periods.
// original article avabile in:" Stocks & Commodities, V. 13:9 (369-374) : A Time Price Oscillator by Tushar Chande, Ph.D.""
strategy("Aroon Oscillator strategy by Saucius", overlay=false)
//building aroon lines, Embodying both Aroon line (Up and Down) and Aroon Oscillator
length = input(19, minval=1)
level_middle = input(-25, minval=-90, maxval=90, step = 5)
levelhigh = input(75,  minval=-100, maxval=100, step = 5)
levellow = input(-85,  minval=-100, maxval=100, step = 5)
upper = 100 * (highestbars(high, length+1) + length)/length
lower = 100 * (lowestbars(low, length+1) + length)/length
oscillator = upper - lower
plot(upper, title="Aroon Up", color=blue)
plot(lower, title="Aroon Down", color=red)
plot(oscillator, title="Aroon Oscillator", color = yellow)
hline(level_middle, title="middle line", color=gray,  linewidth=2)
hline(levelhigh, title ="upper border", color=gray,  linewidth=1)
hline(levellow, title ="lower border", color=gray, linewidth=1)

// Entry //
entryl = oscillator[1] < level_middle[1] and oscillator > level_middle
entrys = oscillator[1] > level_middle[1] and oscillator < level_middle
strategy.entry("Long", true, when = entryl)
strategy.entry("Short", false, when = crossunder (oscillator, level_middle))


// === EXIT===
exitL1 = oscillator[1] > levelhigh[1] and oscillator < levelhigh
exitS1 =  oscillator[1] < levellow[1] and oscillator > levellow
strategy.close("Long", when=entrys)
strategy.close("Short", when=entryl)
strategy.close("Long", when= exitL1)
strategy.close("Short", when= exitS1)