概述
这是一个同时使用Bollinger带和K线形态作为Entry信号的趋势跟踪策略。它旨在在较长的时间周期内捕捉趋势,适用于外汇交易。
策略原理
策略通过计算价格的标准差范围来建立Bollinger带,带宽度代表市场波动性。当价格接近上轨或下轨时看作超买超卖信号。结合特定K线形态judge进场。
具体来说,做多信号为:低点向上突破下轨,且出现多头吞噬或长下影K线。做空信号为:高点向下突破上轨,且出现空头吞噬或长上影K线。
止损方式为预先设置好的止损价。止盈方式为价格穿过布林中线时部分止盈。
优势分析
这种策略结合了趋势和重入机会。Bollinger带能识别趋势和超买超卖机会。K线则判断重入时机,避免假突破。
止盈止损设置明确,风险可控。适合长线操作,减少交易频率。
风险分析
该策略最大的风险在于抓不到趋势或者出现剧烈震荡。这时止损会被连续触发。
另外,止盈离场依赖中线,可能出现止盈过早或者过晚的情况。
可以通过调整参数组合优化,识别更可靠的K线形态,或根据波动率修改止盈标准来改善。
优化方向
可以结合其他指标判断大周期趋势,避免逆势操作。或者增加机器学习算法判断最佳参数组合。
止盈方式也可以改为移动止盈或考虑波动率止盈等,使盈利最大化。
总结
这是一个基于Bollinger带和K线技术指标的较长周期趋势策略。它适合作为基本策略使用,具有一定的可靠性和盈利空间,但依然需要不断测试和优化以提高稳定性。
策略源码
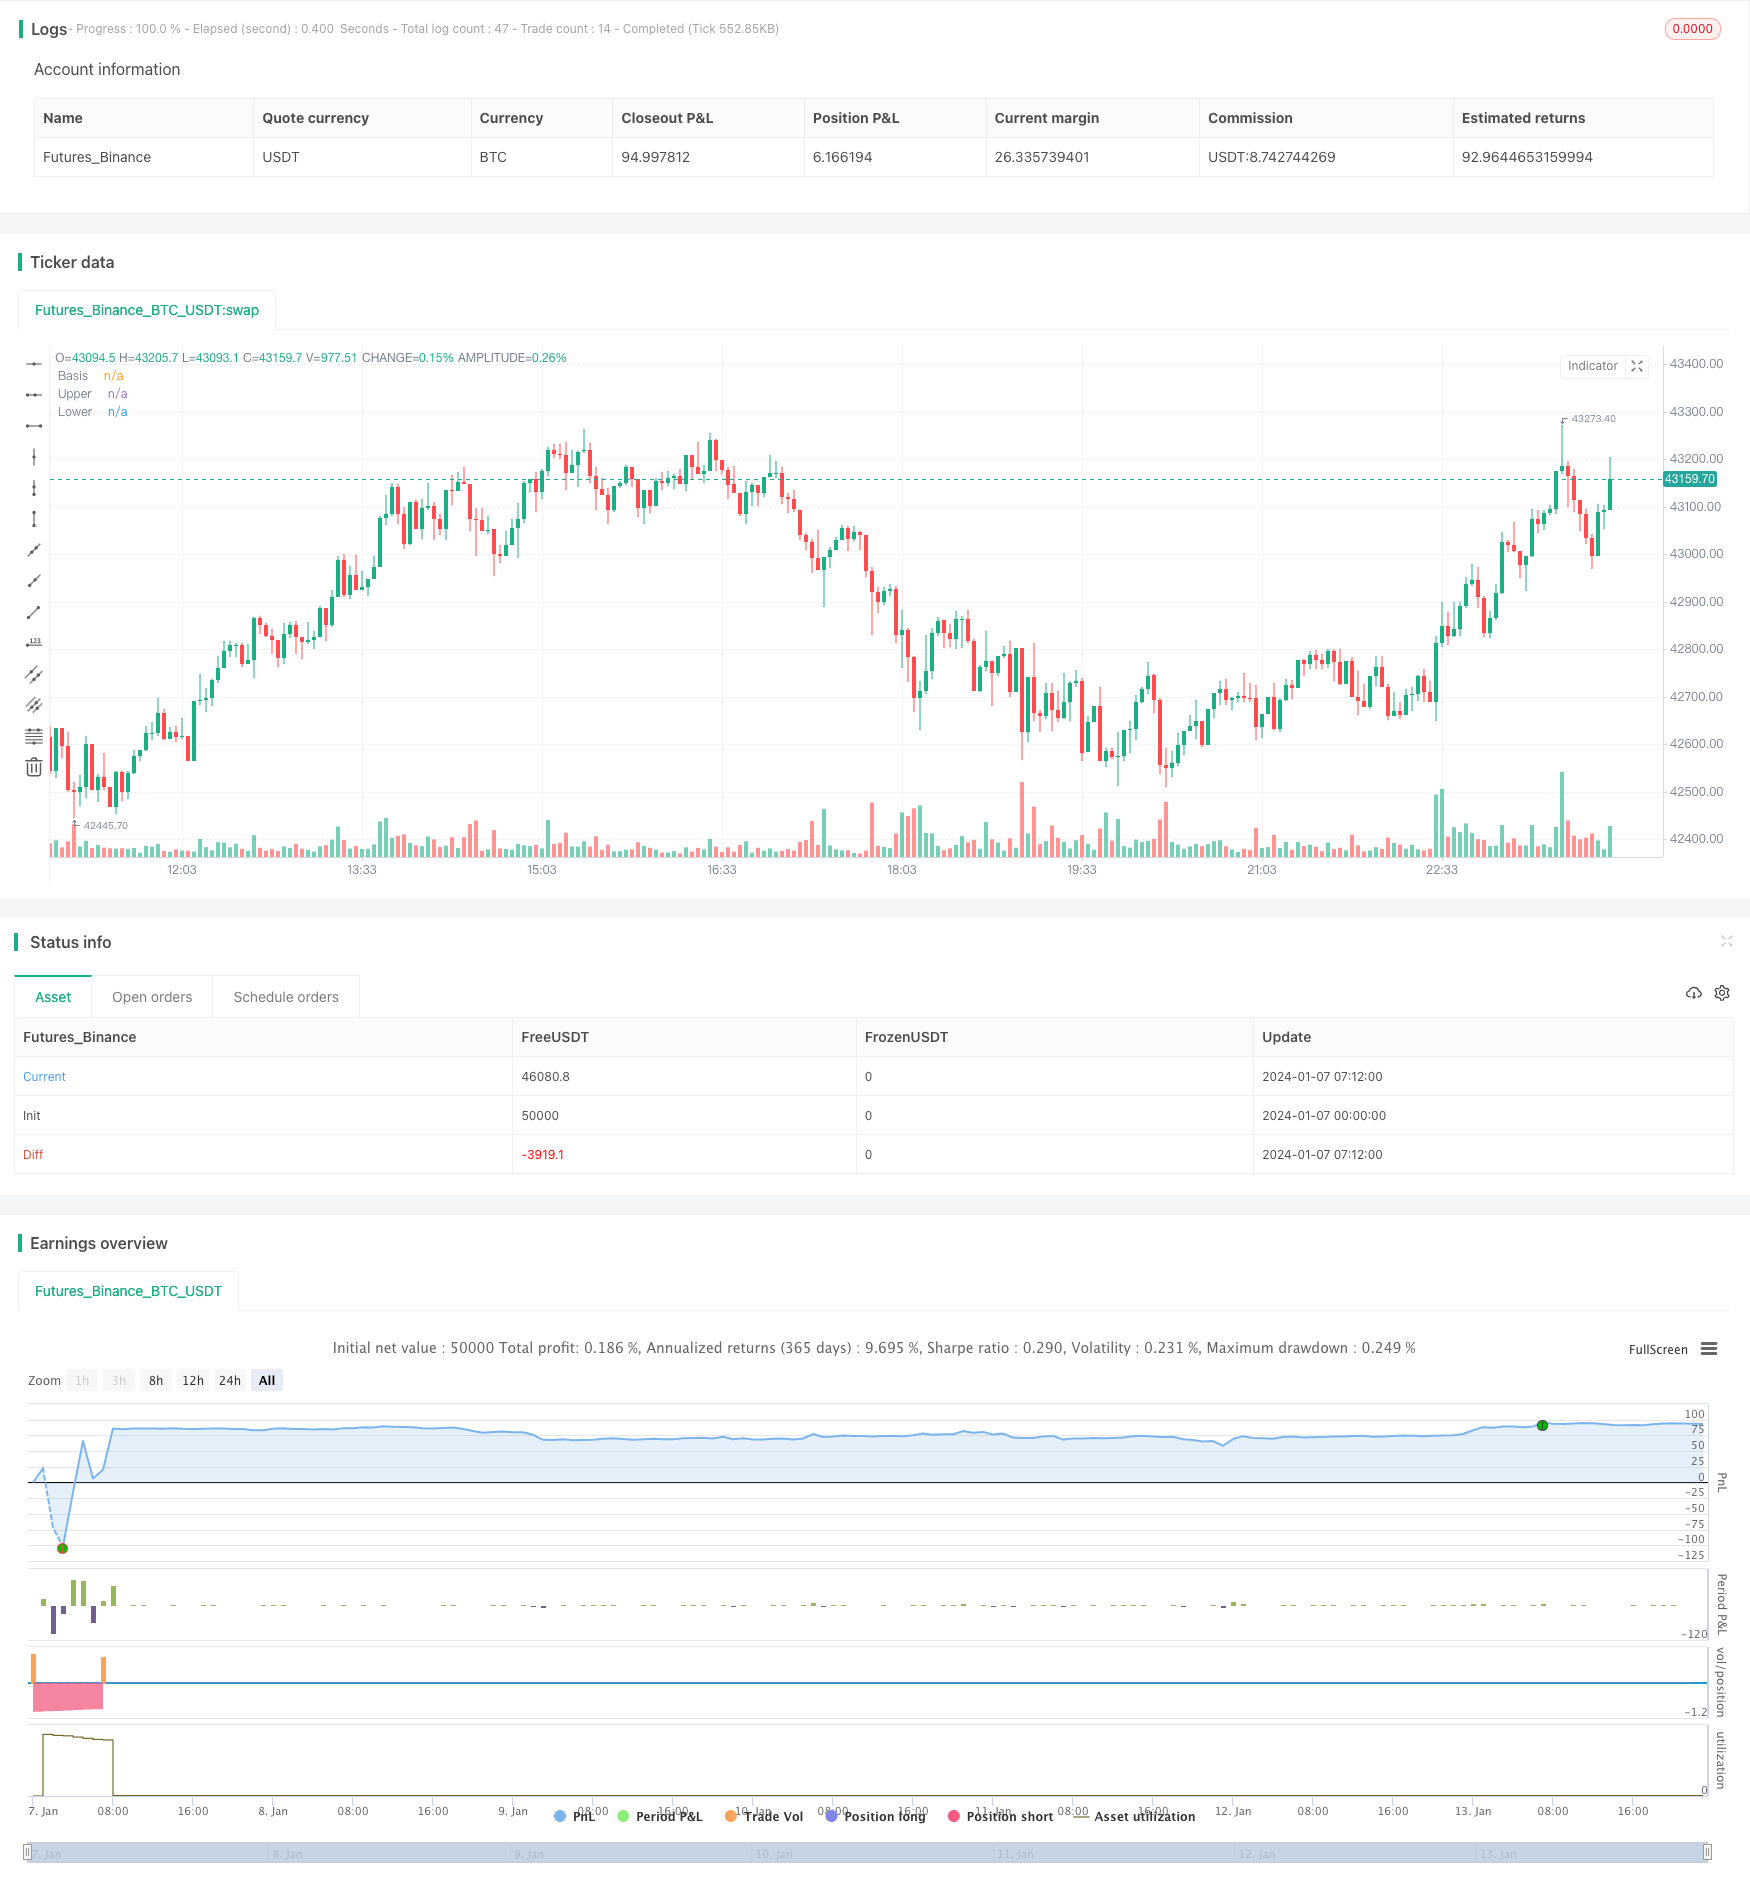
/*backtest
start: 2024-01-07 00:00:00
end: 2024-01-14 00:00:00
period: 3m
basePeriod: 1m
exchanges: [{"eid":"Futures_Binance","currency":"BTC_USDT"}]
*/

//@version=4
strategy("BB策略", overlay=true)
length = input(20, minval=1)
src = input(close, title="Source")
mult = input(2.0, minval=0.001, maxval=50, title="StdDev")
basis = sma(src, length)
dev = mult * stdev(src, length)
upper = basis + dev
lower = basis - dev
offset = input(0, "Offset", type = input.integer, minval = -500, maxval = 500)
plot(basis, "Basis", color=#872323, offset = offset)
p1 = plot(upper, "Upper", color=color.teal, offset = offset)
p2 = plot(lower, "Lower", color=color.teal, offset = offset)
fill(p1, p2, title = "Background", color=#198787, transp=95)
diff=upper-lower
//plot(upper*0.9985, "Upper", color=color.white, offset = offset)
//plot(lower*1.0015, "Lower", color=color.white, offset = offset)

//Engulfing Candles
openBarPrevious = open[1]
closeBarPrevious = close[1]
openBarCurrent = open
closeBarCurrent = close
//If current bar open is less than equal to the previous bar close AND current bar open is less than previous bar open AND current bar close is greater than previous bar open THEN True
bullishEngulfing = openBarCurrent <= closeBarPrevious and openBarCurrent < openBarPrevious and
   closeBarCurrent > openBarPrevious
//If current bar open is greater than equal to previous bar close AND current bar open is greater than previous bar open AND current bar close is less than previous bar open THEN True
bearishEngulfing = openBarCurrent >= closeBarPrevious and openBarCurrent > openBarPrevious and
   closeBarCurrent < openBarPrevious
//bullishEngulfing/bearishEngulfing return a value of 1 or 0; if 1 then plot on chart, if 0 then don't plot
//plotshape(bullishEngulfing, style=shape.triangleup, location=location.belowbar, color=color.green, size=size.tiny)
//plotshape(bearishEngulfing, style=shape.triangledown, location=location.abovebar, color=color.red, size=size.tiny)
//alertcondition(bullishEngulfing, title="Bullish Engulfing", message="[CurrencyPair] [TimeFrame], Bullish candle engulfing previous candle")
//alertcondition(bearishEngulfing, title="Bearish Engulfing", message="[CurrencyPair] [TimeFrame], Bearish candle engulfing previous candle")

//Long Upper Shadow - Bearish
C_Len = 14 // ema depth for bodyAvg
C_ShadowPercent = 5.0 // size of shadows
C_ShadowEqualsPercent = 100.0
C_DojiBodyPercent = 5.0
C_Factor = 2.0 // shows the number of times the shadow dominates the candlestick body
C_BodyHi = max(close, open)
C_BodyLo = min(close, open)
C_Body = C_BodyHi - C_BodyLo
C_BodyAvg = ema(C_Body, C_Len)
C_SmallBody = C_Body < C_BodyAvg
C_LongBody = C_Body > C_BodyAvg
C_UpShadow = high - C_BodyHi
C_DnShadow = C_BodyLo - low
C_HasUpShadow = C_UpShadow > C_ShadowPercent / 100 * C_Body
C_HasDnShadow = C_DnShadow > C_ShadowPercent / 100 * C_Body
C_WhiteBody = open < close
C_BlackBody = open > close
C_Range = high-low
C_IsInsideBar = C_BodyHi[1] > C_BodyHi and C_BodyLo[1] < C_BodyLo
C_BodyMiddle = C_Body / 2 + C_BodyLo
C_ShadowEquals = C_UpShadow == C_DnShadow or (abs(C_UpShadow - C_DnShadow) / C_DnShadow * 100) < C_ShadowEqualsPercent and (abs(C_DnShadow - C_UpShadow) / C_UpShadow * 100) < C_ShadowEqualsPercent
C_IsDojiBody = C_Range > 0 and C_Body <= C_Range * C_DojiBodyPercent / 100
C_Doji = C_IsDojiBody and C_ShadowEquals
patternLabelPosLow = low - (atr(30) * 0.6)
patternLabelPosHigh = high + (atr(30) * 0.6)
C_LongUpperShadowBearishNumberOfCandles = 1
C_LongShadowPercent = 75.0
C_LongUpperShadowBearish = C_UpShadow > C_Range/100*C_LongShadowPercent
//alertcondition(C_LongUpperShadowBearish, title = "Long Upper Shadow", message = "New Long Upper Shadow - Bearish pattern detected.")
//if C_LongUpperShadowBearish
//    var ttBearishLongUpperShadow = "Long Upper Shadow\nTo indicate buyer domination of the first part of a session, candlesticks will present with long upper shadows, as well as short lower shadows, consequently raising bidding prices."
//    label.new(bar_index, patternLabelPosHigh, text="LUS", style=label.style_label_down, color = color.red, textcolor=color.white, tooltip = ttBearishLongUpperShadow)
//gcolor(highest(C_LongUpperShadowBearish?1:0, C_LongUpperShadowBearishNumberOfCandles)!=0 ? color.red : na, offset=-(C_LongUpperShadowBearishNumberOfCandles-1))

C_Len1 = 14 // ema depth for bodyAvg
C_ShadowPercent1 = 5.0 // size of shadows
C_ShadowEqualsPercent1 = 100.0
C_DojiBodyPercent1 = 5.0
C_Factor1 = 2.0 // shows the number of times the shadow dominates the candlestick body

C_BodyHi1 = max(close, open)
C_BodyLo1 = min(close, open)
C_Body1 = C_BodyHi1 - C_BodyLo1
C_BodyAvg1 = ema(C_Body1, C_Len1)
C_SmallBody1 = C_Body1 < C_BodyAvg1
C_LongBody1 = C_Body1 > C_BodyAvg1
C_UpShadow1 = high - C_BodyHi1
C_DnShadow1 = C_BodyLo1 - low
C_HasUpShadow1 = C_UpShadow1 > C_ShadowPercent1 / 100 * C_Body1
C_HasDnShadow1 = C_DnShadow1 > C_ShadowPercent1 / 100 * C_Body1
C_WhiteBody1 = open < close
C_BlackBody1 = open > close
C_Range1 = high-low
C_IsInsideBar1 = C_BodyHi1[1] > C_BodyHi1 and C_BodyLo1[1] < C_BodyLo1
C_BodyMiddle1 = C_Body1 / 2 + C_BodyLo1
C_ShadowEquals1 = C_UpShadow1 == C_DnShadow1 or (abs(C_UpShadow1 - C_DnShadow1) / C_DnShadow1 * 100) < C_ShadowEqualsPercent1 and (abs(C_DnShadow1 - C_UpShadow1) / C_UpShadow1 * 100) < C_ShadowEqualsPercent1
C_IsDojiBody1 = C_Range1 > 0 and C_Body1 <= C_Range1 * C_DojiBodyPercent1 / 100
C_Doji1 = C_IsDojiBody1 and C_ShadowEquals1

patternLabelPosLow1 = low - (atr(30) * 0.6)
patternLabelPosHigh1 = high + (atr(30) * 0.6)

C_LongLowerShadowBullishNumberOfCandles1 = 1
C_LongLowerShadowPercent1 = 75.0
C_LongLowerShadowBullish1 = C_DnShadow1 > C_Range1/100*C_LongLowerShadowPercent1
//alertcondition1(C_LongLowerShadowBullish1, title = "Long Lower Shadow", message = "New Long Lower Shadow - Bullish pattern detected.")

// Make input options that configure backtest date range
startDate = input(title="Start Date", type=input.integer,
     defval=1, minval=1, maxval=31)
startMonth = input(title="Start Month", type=input.integer,
     defval=1, minval=1, maxval=12)
startYear = input(title="Start Year", type=input.integer,
     defval=2018, minval=1800, maxval=2100)
endDate = input(title="End Date", type=input.integer,
     defval=1, minval=1, maxval=31)
endMonth = input(title="End Month", type=input.integer,
     defval=11, minval=1, maxval=12)
endYear = input(title="End Year", type=input.integer,
     defval=2030, minval=1800, maxval=2100)
// Look if the close time of the current bar
// falls inside the date range
inDateRange = true

//多單
if ((bullishEngulfing or C_LongLowerShadowBullish1) and inDateRange and cross(low,lower))
    strategy.entry("L", strategy.long, qty=1,stop=(low[1]))
//strategy.close("L",comment = "L exit",when=cross(basis,close),qty_percent=50)
if crossunder(close,upper*0.9985)
    strategy.close("L",comment = "L exit",qty_percent=1)

//空單
if (((bullishEngulfing == 0) or C_LongUpperShadowBearish) and inDateRange and cross(close,upper))
    strategy.entry("S", strategy.short,qty= 1,stop=(high[1]))
//strategy.close("S",comment = "S exit",when=cross(basis,close),qty_percent=50)
if crossunder(lower*1.0015,close)
    strategy.close("S",comment = "S exit",qty_percent=1)