概述
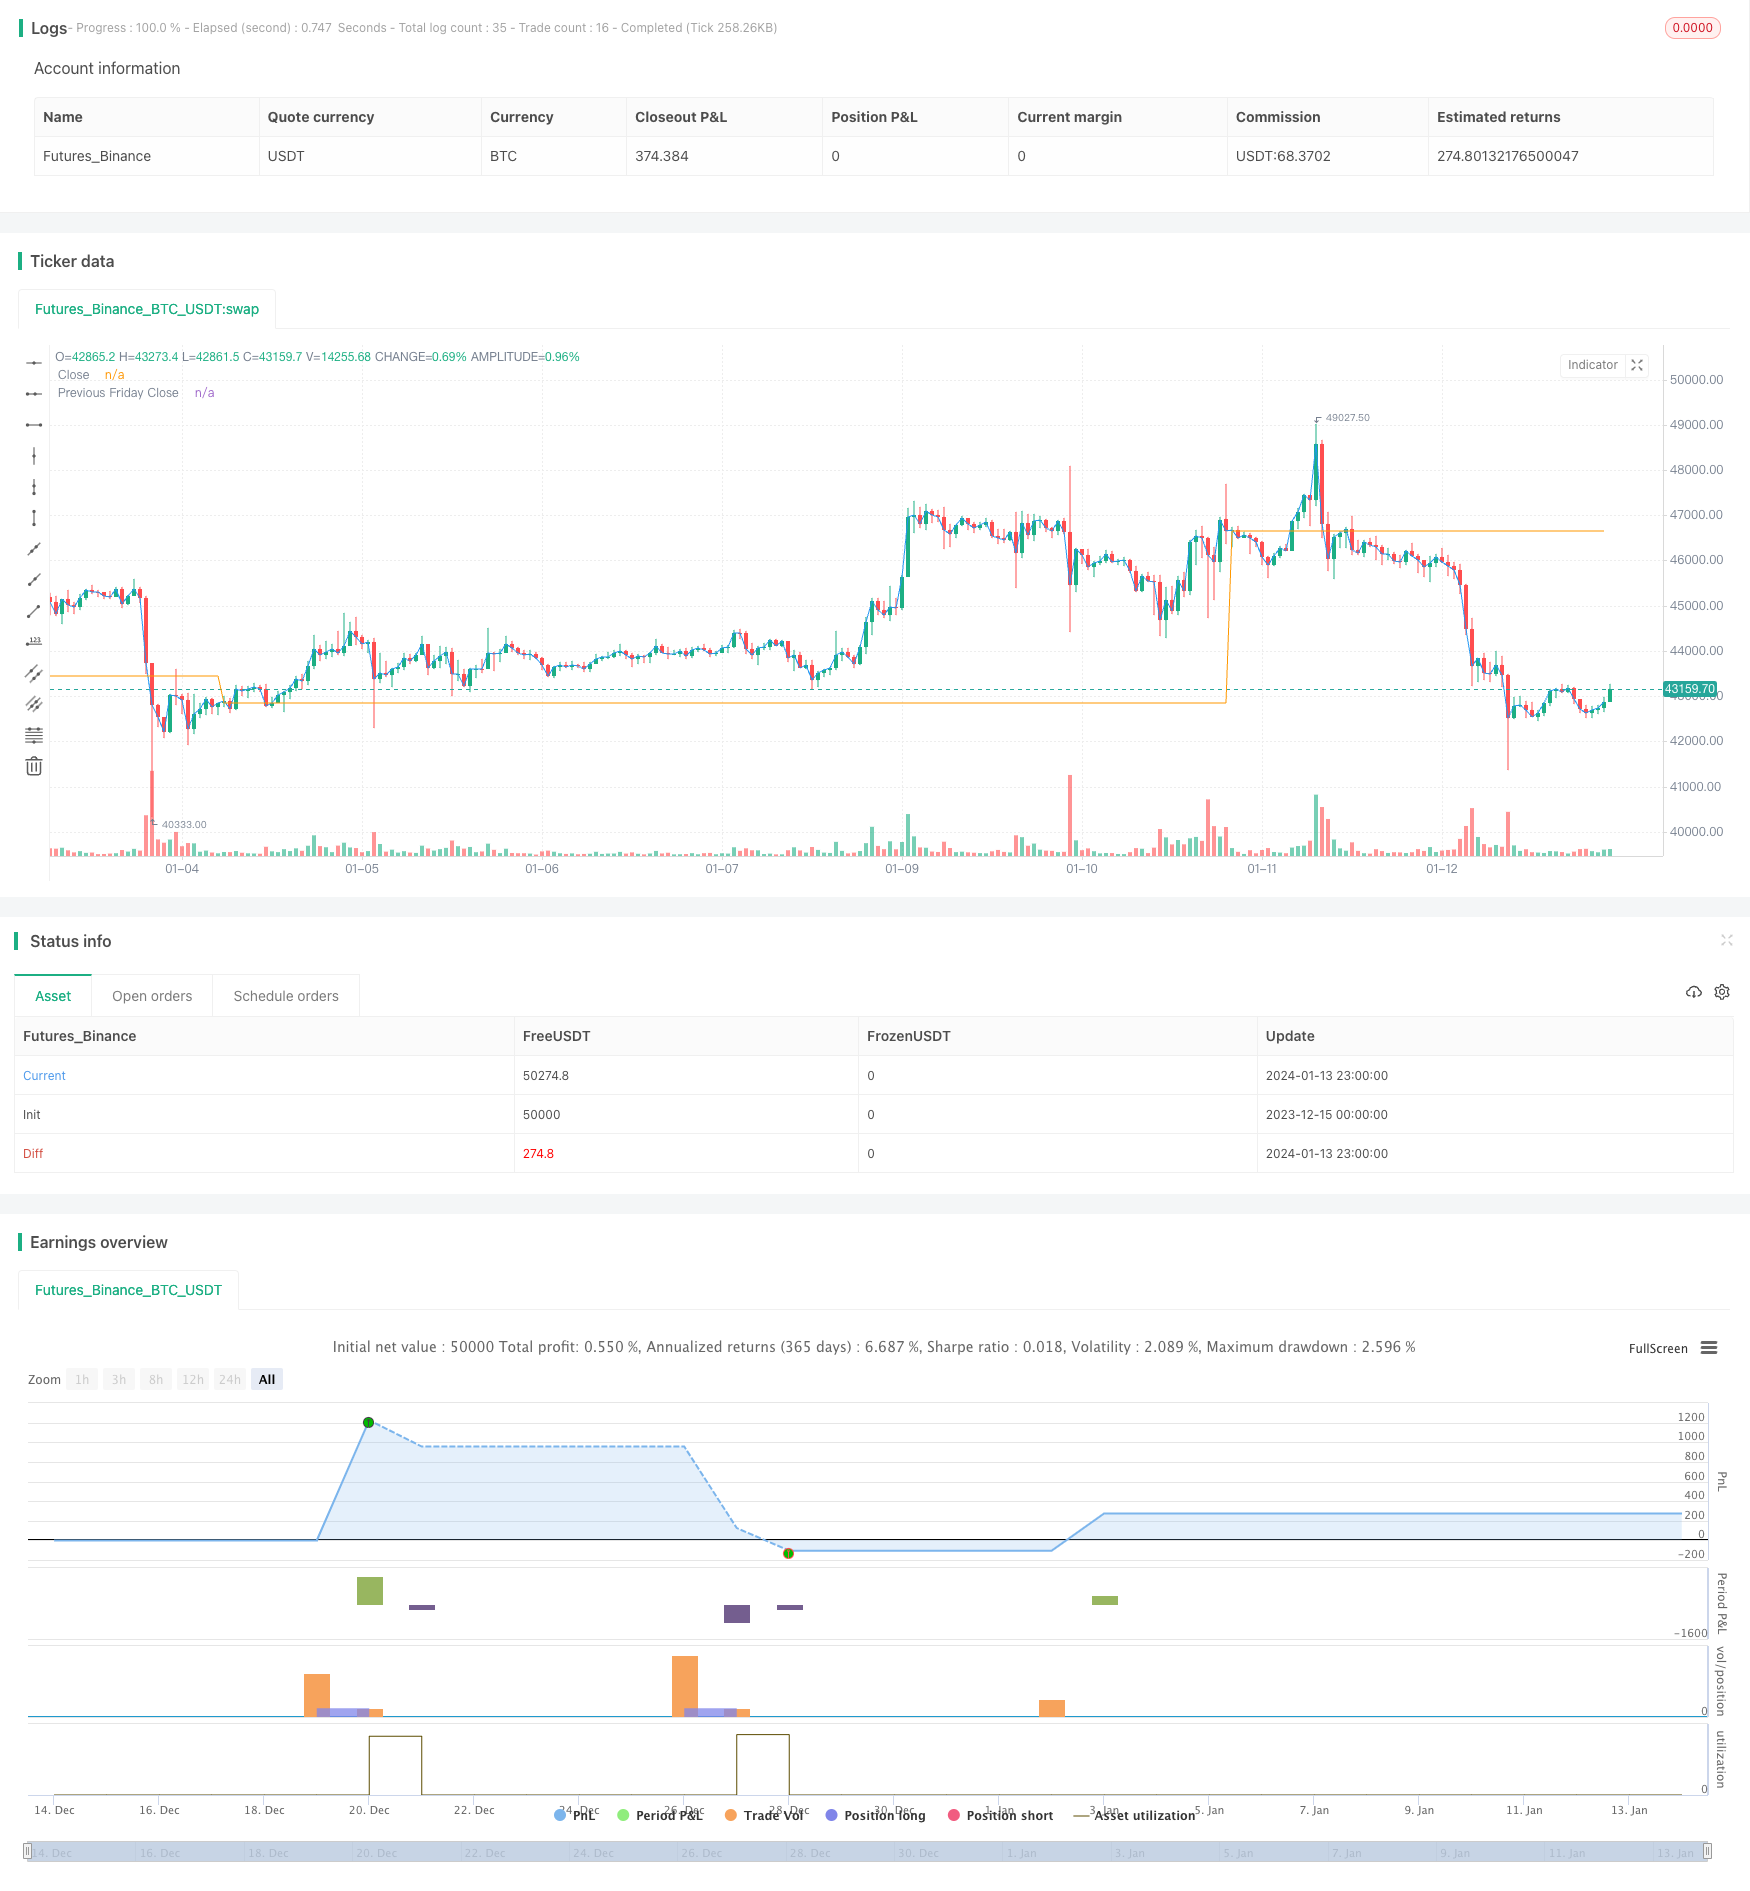
该策略是一个基于日内波动性指标IBS和周线高点的简单SP500期货交易策略。它只在周一开盘时发出交易信号,利用IBS低于0.5和价格低于上周五收盘价的条件判断入场时机。之后将在5个交易日后平仓退出。
策略原理
该策略主要基于两个指标进行判断:
IBS - 日内波动性指标,用于判断当天的波动性是否足够低。计算方法为:(收盘价 - 最低价) / (最高价 - 最低价)。当IBS低于0.5时,认为波动性较低,适合入场。
周线高点 - 使用上周五的收盘价作为参考高点。如果当前周一收盘价低于上周五收盘价,则可能形成转折,产生交易机会。
入场条件为:周一 + IBS < 0.5 + 收盘价 < 上周五收盘价。
出场条件为:5个交易日后收盘或次日开盘即刻高点取反。
策略优势
该策略主要具有以下优势:
- 策略逻辑简单清晰,容易理解和实现。
- 只在周一开盘才可能发出信号,避免过度交易。
- 利用IBS指标判断日内波动性,有利锁定趋势转换点。
- 周线结构参考简单有效,容易判断是否形成转折。
- 风险控制到位, Drawdown有限。
策略风险
该策略也存在一些风险:
- IBS和周线结构判断依据仅为技术指标,可能出现误判的情况。
- 固定5天出场时间导致可能额外损益。应设置动态出场条件。
- 仅交易周一周期性很强,信号频次过低,容易错过其他时间段信号。
- 回撤控制可能欠佳,最大回撤可能过大。
策略优化
该策略可以从以下几个方面进行优化:
增加更多技术指标的确认,提高信号准确率。例如增强短期趋势、支撑压力位、成交量等指标的判断逻辑。
设置动态出场条件,根据实时波动设置止损或止盈价格。避免固定时间导致的额外损益。
扩大策略交易时间段,不限于周一。合理设置其他交易日的入场条件,提高信号覆盖面。
引入风险管理模块,利用止损策略控制回撤。可以设置浮动止损、跟踪止损等方式优化。
总结
本策略总体来说是一个基于日内指标IBS和周线结构判断的简单短线交易策略。策略思路清晰,实现简单,风险容易控制。但也存在一定概率的信号误判和潜在回撤过大的问题。未来优化空间在于加入更多技术指标判断,设置动态止损机制等。通过不断测试和优化,逐步提高策略胜率和盈利能力。
策略源码
/*backtest
start: 2023-12-15 00:00:00
end: 2024-01-14 00:00:00
period: 1h
basePeriod: 15m
exchanges: [{"eid":"Futures_Binance","currency":"BTC_USDT"}]
*/

// This source code is subject to the terms of the Mozilla Public License 2.0 at https://mozilla.org/MPL/2.0/
// © hobbiecode

// Today is Monday.
// The close must be lower than the close on Friday.
// The IBS must be below 0.5.
// If 1-3 are true, then enter at the close.
// Sell 5 trading days later (at the close).

//@version=5
strategy("Hobbiecode - SP500 IBS + Higher", overlay=true)

// Check if it's Monday
isMonday = dayofweek(time) == dayofweek.monday

// Calculate the IBS (Intraday Breadth Strength) indicator
ibs = (close - low) / (high - low)

// Calculate the close on the previous Friday
prevFridayClose = request.security(syminfo.tickerid, "W", close[1])

// Entry conditions
enterCondition = isMonday and close < prevFridayClose and ibs < 0.5 and strategy.position_size < 1

// Exit conditions
exitCondition = (close > high[1] or ta.barssince(enterCondition) == 4) and strategy.position_size > 0

// Entry signal
if enterCondition
    strategy.entry("Buy", strategy.long)

// Exit signal
if exitCondition
    strategy.close("Buy")

// Plotting the close, previous Friday's close, and entry/exit points on the chart
plot(close, title="Close", color=color.blue)
plot(prevFridayClose, title="Previous Friday Close", color=color.orange)
plotshape(enterCondition, title="Enter", location=location.belowbar, color=color.green, style=shape.labelup, text="Enter")
plotshape(exitCondition, title="Exit", location=location.abovebar, color=color.red, style=shape.labeldown, text="Exit")