Myo_LS_D量化策略
概述
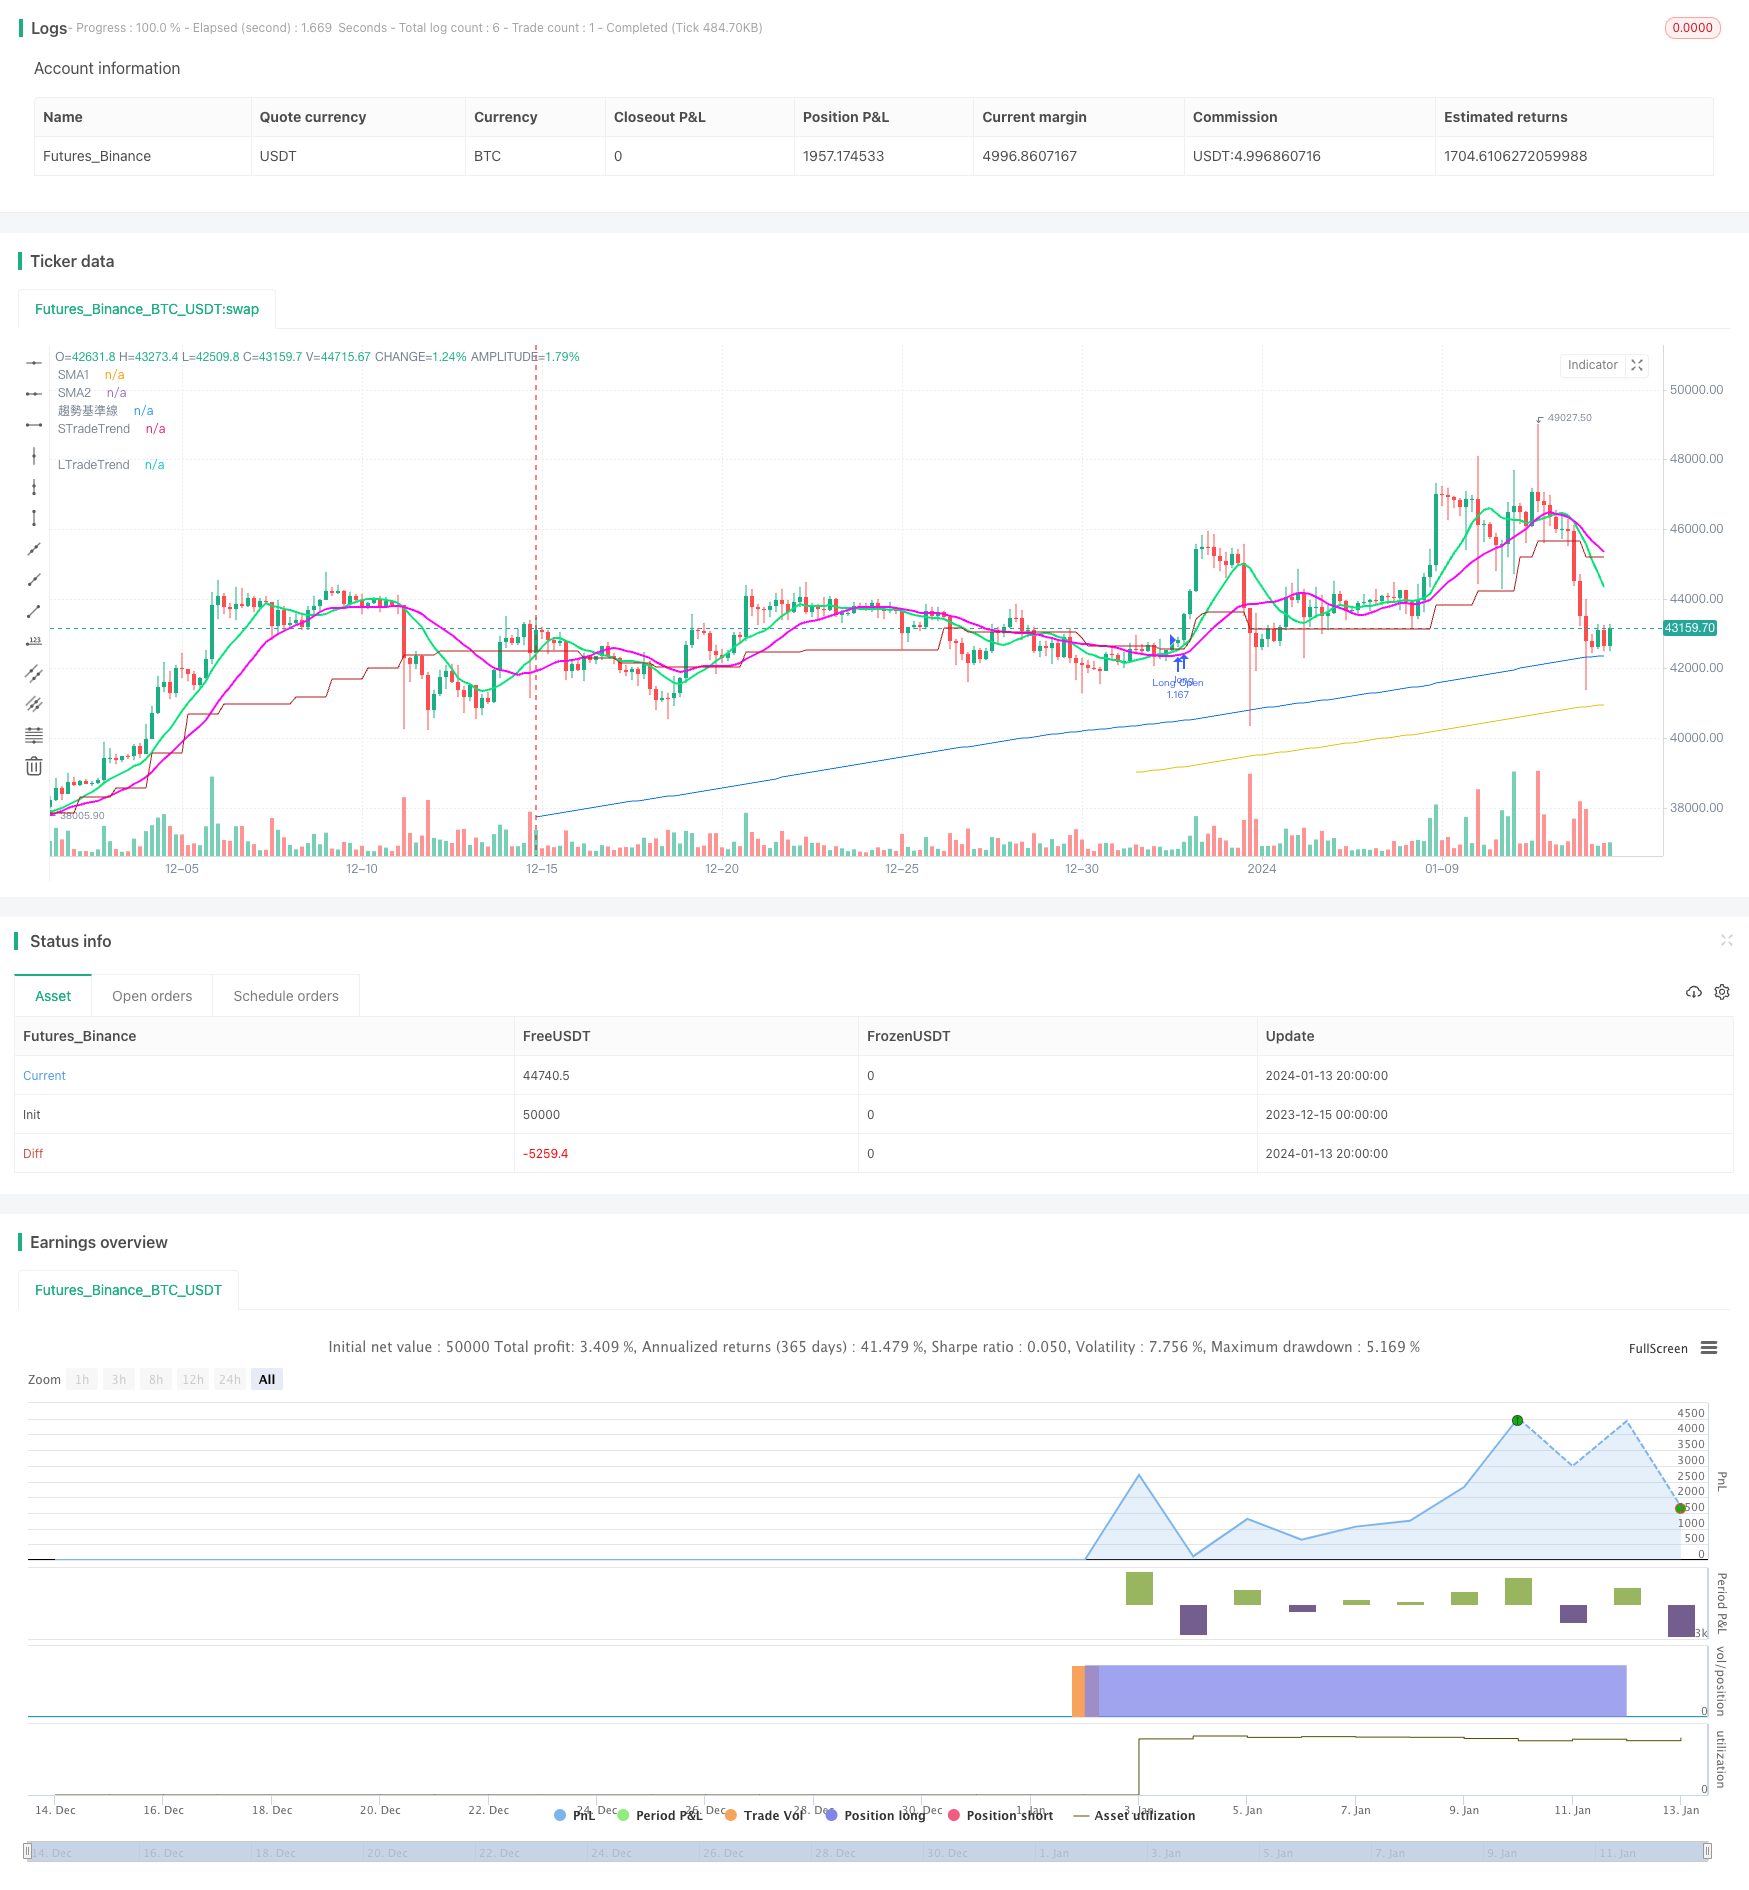
Myo_LS_D量化策略是一个基于多空双轨的追踪止盈策略。该策略综合利用均线、价格突破、风险回报比等多个指标构建交易信号。在趋势判断准确的前提下,实现了较高的胜率和盈利率。
策略原理
该策略主要由趋势判断模块、做多模块、做空模块、追踪止盈模块等组成。
趋势判断模块运用donchain通道判断整体趋势方向。做多进入的前提是处于上升趋势,做空则需要处于下降趋势。
做多模块考量了新的高点、低点、长线均线位置等因素。做空模块考量了新的高点、低点、短线均线位置等因素。这确保了在向上或向下突破关键价格点时建仓。
追踪止盈模块使用两条不同周期的SMA均线实时追踪价格变动。当价格跌破均线时平仓止盈。这种实时追踪可以最大化获取趋势中的利润。
止损设置考虑扩大止损,确保止损点距离支持位较远,避免被震出。
优势分析
该策略最大的优势在于多空分离建仓,追踪止盈策略。具体来说主要体现在:
多空分离可以最大化抓取单边趋势行情的盈利机会。
追踪止盈通过实时调整可以获得更高的盈利率。与传统止盈方法相比,收益能获得显著提升。
扩大止损可以减少被震出的概率,降低亏损风险。
风险及解决
该策略主要的风险集中在以下几点:
趋势判断出现错误,可能造成逆势建仓亏损。可以适当调整donchain参数或添加其他指标判断来优化。
追踪止盈过于激进,可能提前止盈无法持续获利。可以适当扩大止盈均线间距来优化。
止损范围过小,可能增加被震出概率。可以适当扩大止损幅度以降低风险。
优化方向
该策略主要可以从以下几个方面继续优化:
优化趋势判断模块,提高判断准确性。可考虑结合更多指标如MACD等来实现。
调整追踪止盈方式,进一步扩大获利空间。例如可以按比例移动止盈线等。
扩大止损范围或考虑缩进止损来进一步降低被震出概率。
不同品种参数不一样,可以训练获得最优参数组合。进一步提升策略收益。
总结
Myo_LS_D策略总体来说是一个比较成熟稳定的多空追踪止盈策略。它优势明显,风险可控,是值得长期持有使用的量化方案之一。未来通过进一步优化,可以使其收益性能得到持续提升,成为更加卓越的量化策略。
/*backtest
start: 2023-12-15 00:00:00
end: 2024-01-14 00:00:00
period: 4h
basePeriod: 15m
exchanges: [{"eid":"Futures_Binance","currency":"BTC_USDT"}]
*/

// This source code is subject to the terms of the Mozilla Public License 2.0 at https://mozilla.org/MPL/2.0/
// © agresiynin

//@version=5
// ©Myo_Pionex
strategy(
 title                  =   "Myo_simple strategy_LS_D",
 shorttitle             =   "Myo_LS_D",
 overlay                =   true )


// var
lowest_price = ta.lowest(low, 200)
highest_price = ta.highest(high, 200)
min_800 = ta.lowest(low, 800)
max_800 = ta.highest(high, 800)
tp_target_L = min_800 + (max_800 - min_800) * math.rphi
tp_target_S = max_800 - (max_800 - min_800) * math.rphi
sl_length_L = input.int(100, "做多的止損長度", minval = 50, maxval = 300, step = 50)
sl_length_S = input.int(100, "做空的止損長度", minval = 50, maxval = 300, step = 50)
sl_L = lowest_price * (1 - 0.005)
sl_S = highest_price * (1 + 0.005)
rrr_L = tp_target_L - sl_L / sl_L
rrr_S = ta.lowest(low, 800) + ta.highest(high, 800) - ta.lowest(low, 800) * math.rphi / ta.highest(high, 200) + 0.005 * ta.highest(high, 200) - ta.lowest(low, 200) - 0.005 * ta.lowest(low, 200)
smalen1 = input.int(10, "做多追蹤止盈SMA長度1", options = [5, 10, 20, 40, 60, 80])
smalen2 = input.int(20, "做多追蹤止盈SMA長度2", options = [5, 10, 20, 40, 60, 80])
smalen1_S = input.int(5, "做空追蹤止盈SMA長度1", options = [5, 10, 20, 40, 60, 80])
smalen2_S = input.int(10, "做空追蹤止盈SMA長度2", options = [5, 10, 20, 40, 60, 80])
TrendLength_L = input.int(400, "做多趨勢線", options = [100, 200, 300, 400, 500])
TrendLength_S = input.int(300, "做空趨勢線", options = [100, 200, 300, 400, 500])
SMA1 = ta.sma(close, smalen1)
SMA2 = ta.sma(close, smalen2)
SMA1_S = ta.sma(close, smalen1_S)
SMA2_S = ta.sma(close, smalen2_S)
shortlength = input.int(20, "短期均價K線數量")
midlength = input.int(60, "中期均價K線數量")
longlength = input.int(120, "長期均價K線數量")
ShortAvg = math.sum(close, shortlength)/shortlength
MidAvg = math.sum(close, midlength)/midlength
LongAvg = math.sum(close, longlength)/longlength

// Trend
basePeriods = input.int(8, minval=1, title="趨勢基準線")
basePeriods_Short = input.int(26, "做空基準線")
donchian(len) => math.avg(ta.lowest(len), ta.highest(len))
baseLine = donchian(basePeriods)
baseLine_Short = donchian(basePeriods_Short)
trend = request.security(syminfo.tickerid, "D", baseLine)
isUptrend = false
isDowntrend = false
baseLine_D = request.security(syminfo.tickerid, "D", baseLine)
plot(baseLine_D, color=#B71C1C, title="趨勢基準線")
if close[0] > baseLine_D
    isUptrend := true
if close[0] < baseLine_Short
    isDowntrend := true
// Long
// Condition
// entry
con_a = low > lowest_price ? 1 : 0
con_b = high > highest_price ? 1 : 0
con_c = close[0] > ta.sma(close, TrendLength_L) ? 1 : 0
con_d = isUptrend ? 1 : 0
con_e = rrr_L > 3 ? 1 : 0
con_a1 = close[0] > ShortAvg[shortlength] ? 1 : 0
con_b1 = close[0] > MidAvg[midlength] ? 1 : 0

// close
con_f = ta.crossunder(close, SMA1) and ta.crossunder(close, SMA2) ? 1 : 0
con_g = close < ta.lowest(low, sl_length_L)[1] * (1 - 0.005) ? 1 : 0

// exit
con_h = tp_target_L

// Main calculation
LongOpen = false
AddPosition_L = false

if con_a + con_b + con_c + con_e + con_a1 + con_b1 >= 4 and con_d >= 1
    LongOpen := true
// Short
// Condition
// entry
con_1 = high < highest_price ? 1 : 0
con_2 = low < lowest_price ? 1 : 0
con_3 = close[0] < ta.sma(close, TrendLength_S) ? 1 : 0
con_4 = isDowntrend ? 1 : 0
con_5 = rrr_S > 3 ? 1 : 0
con_11 = close[0] < ShortAvg[shortlength] ? 1 : 0
con_12 = close[0] < MidAvg[midlength] ? 1 : 0

// close
con_6 = ta.crossover(close, SMA1_S) and ta.crossover(close, SMA2_S) ? 1 : 0
con_7 = close > ta.highest(high, sl_length_S)[1] * (1 + 0.005) ? 1 : 0

// exit
con_8 = tp_target_S

// Main calculation
ShortOpen = false
AddPosition_S = false

if con_1 + con_2 + con_3 + con_4 + con_5 + con_11 + con_12 >= 5
    ShortOpen := true

//
// execute
//
strategy.initial_capital = 50000
if strategy.position_size == 0
    if LongOpen
        strategy.entry("Long Open" , strategy.long , comment= "Long Open " + str.tostring(close[0]), qty=strategy.initial_capital/close[0])

if strategy.position_size > 0
    if (con_f > 0 or con_g > 0 or ShortOpen) and close <= baseLine_D
        strategy.close_all(comment="Close Long " + str.tostring(close[0]))

if strategy.position_size == 0
    if ShortOpen
        strategy.entry("Short Open" , strategy.short , comment= "Short Open " + str.tostring(close[0]), qty=strategy.initial_capital/close[0])

if strategy.position_size < 0
    if (con_6 > 0 or con_7 > 0 or LongOpen) and close >= baseLine_D
        strategy.close_all(comment="Close Short " + str.tostring(close[0]))


plot(ta.sma(close, TrendLength_L), color=#e5c212, title="LTradeTrend")
plot(ta.sma(close, TrendLength_S), color=#1275e5, title="STradeTrend")
plot(SMA1, "SMA1", color = color.lime, linewidth = 2)
plot(SMA2, "SMA2", color = color.rgb(255, 0, 255), linewidth = 2)