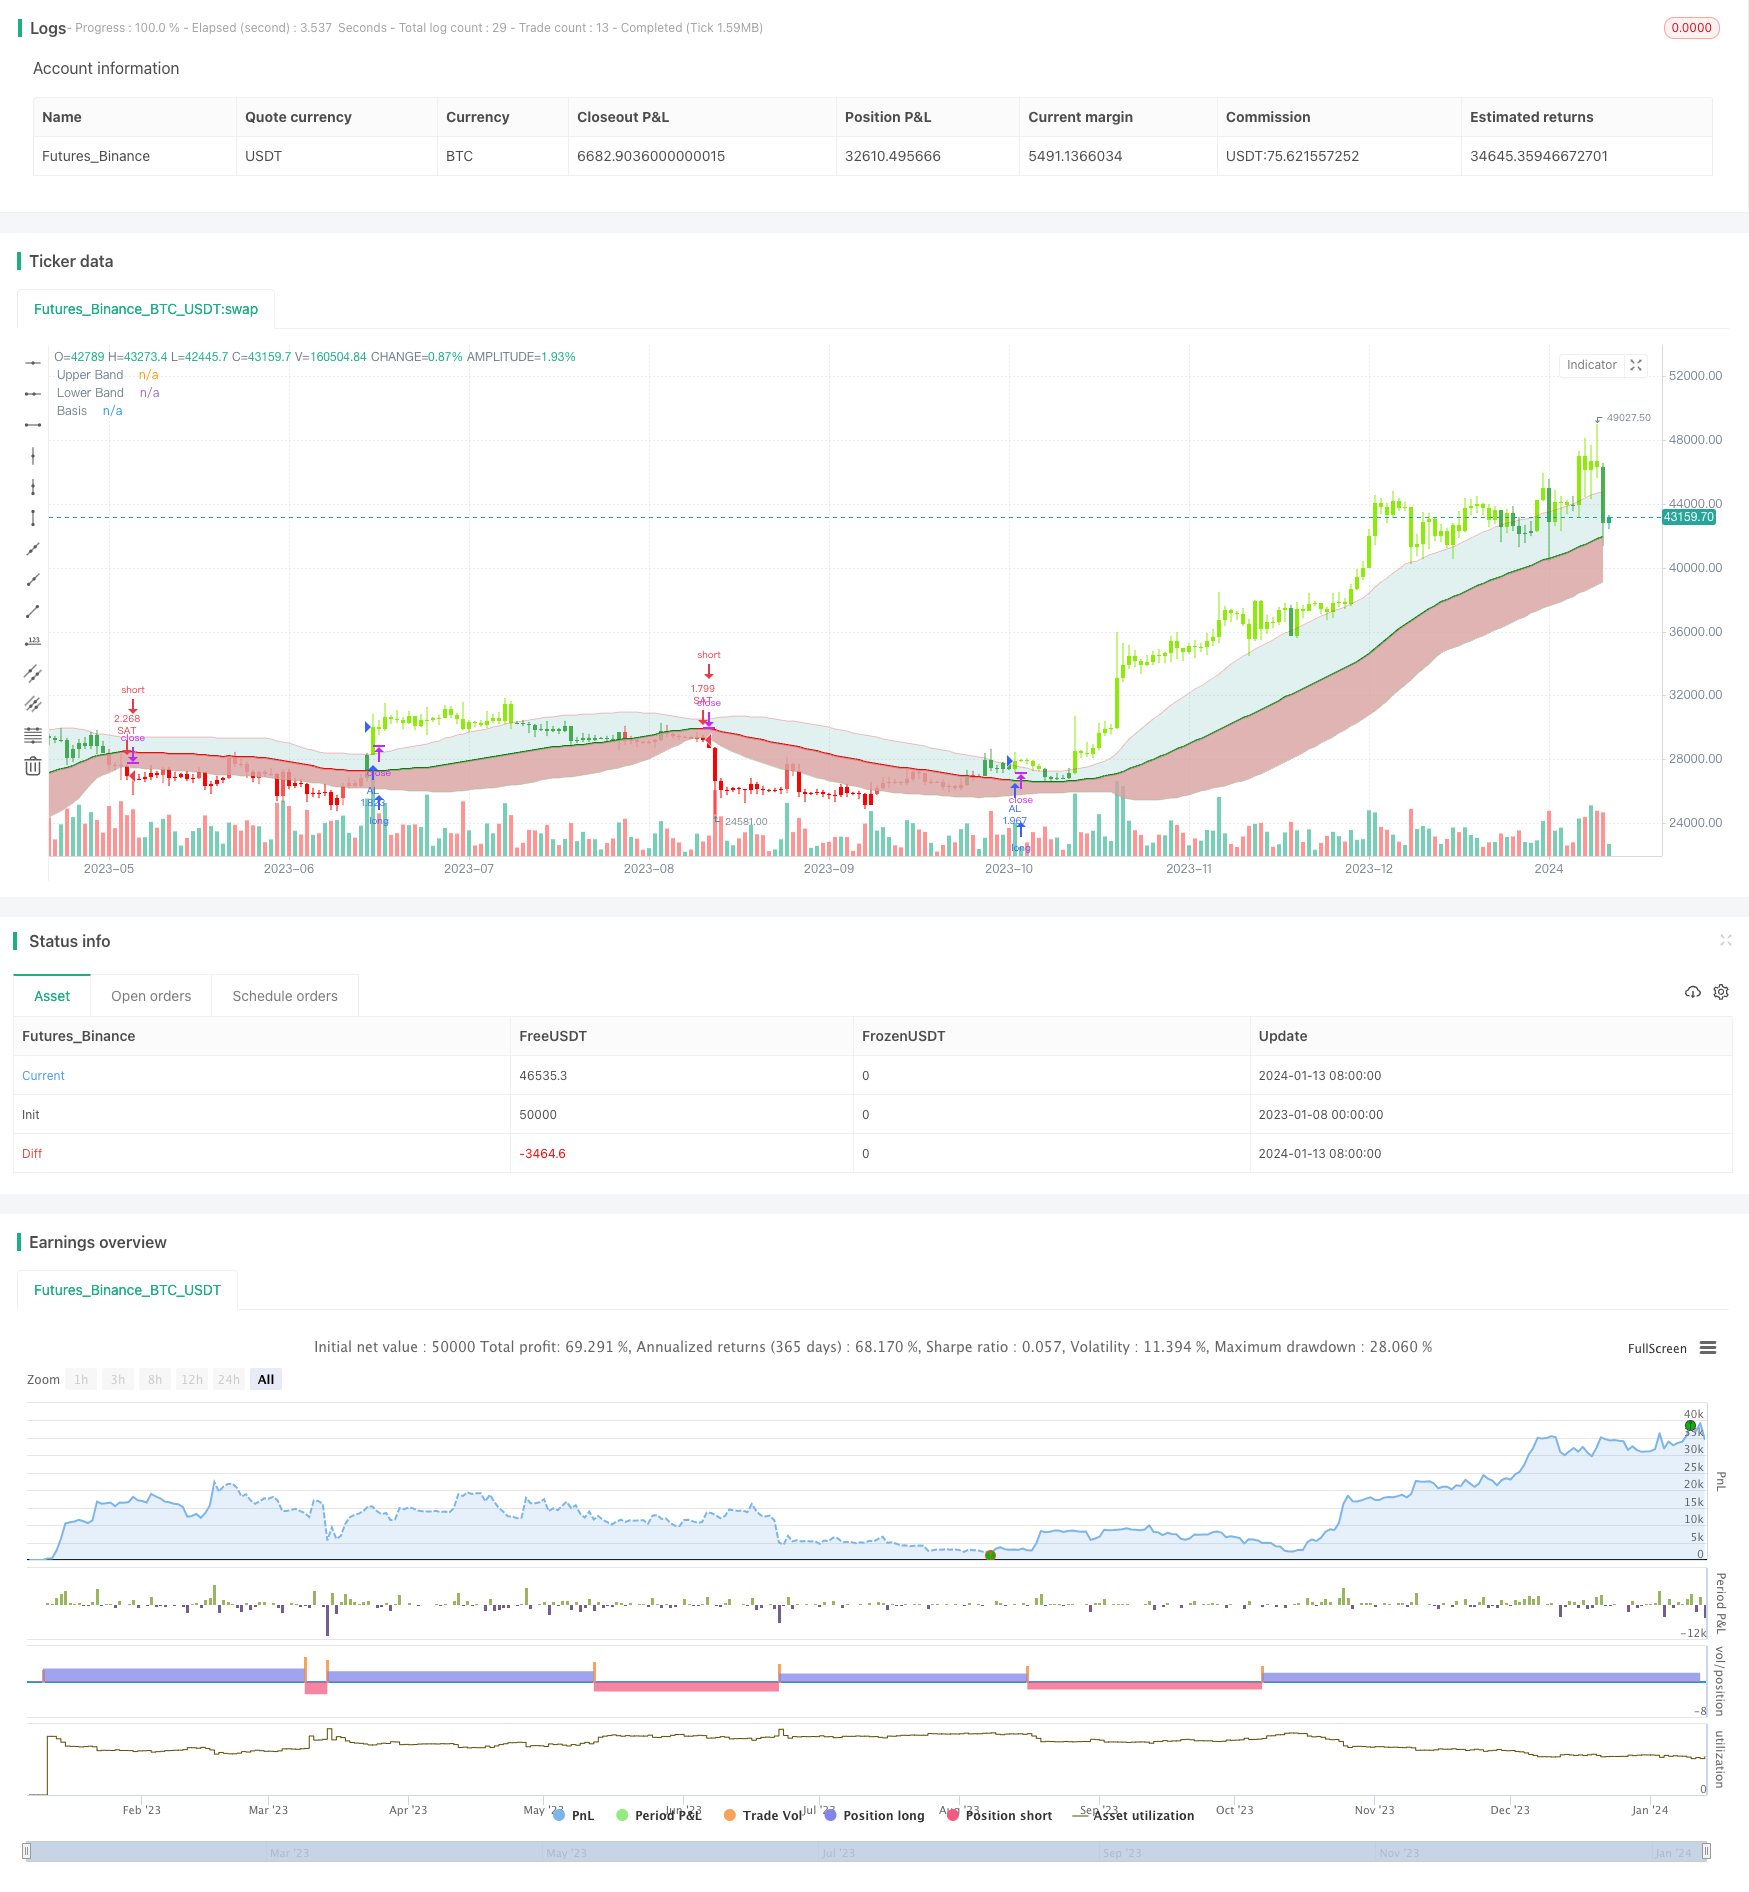
概述
玻尔波带波动信号策略(Bollinger Wave Strategy)是一种结合玻尔波带和移动平均线的量化交易策略。该策略通过计算玻尔波带的标准差和移动平均线的交叉信号,判断市场趋势和超买超卖区域,产生交易信号。
策略原理
该策略首先计算指定周期内的指数移动平均线(EMA)作为基准线。然后根据这个EMA计算上轨线(EMA + n倍标准差)和下轨线(EMA - n倍标准差)。当价格突破上轨线时为超买信号,当价格跌破下轨线时为超卖信号。
当价格在上轨线和下轨线之间时,是股票的常态价格波动区间。此外,该策略结合RSI指标等其他指标过滤交易信号,降低交易频率,减少不必要的损失。
具体来说,该策略的交易信号判断规则如下:
- 多头信号:收盘价>上轨线 且 RSI(14)>60
- 空头信号:收盘价<下轨线 且 RSI(14)<40
当出现上述交易信号时,按固定数量或账户比例方式入场。当价格重新回到波带范围时或相反信号出现时,退出持仓。
策略优势
该策略结合了趋势判断和超买超卖判定,避免在震荡盘整中错误交易。与单一指标策略相比,可减少不必要的头寸开仓,有效控制风险。
相比简单移动平均线策略,玻尔波带更能反映当前市场波动性和风险水平。波带宽度小时,交易信号更可靠;波带宽度大时,交易频率会自动降低。这种自适应调整能根据不同市况控制策略风险。
另外,该策略通过RSI等指标进行双重确认,可过滤掉一些假信号,避免在趋势转折点错误交易。这也提高了策略胜率。
风险分析
该策略主要面临以下风险:
参数优化风险。如果移动平均线参数或标准差倍数设置不当,会产生更多噪音交易或错过交易机会。需要对这些参数进行反复测试和优化。
突破假信号风险。当价格出现短期突破上下轨线后很快重新回调的情况,会产生错误信号。此时若贸然交易会增加损失。可以通过加大移动平均线周期或设置止损来控制这种风险。
交易频率风险。如果上下轨线间隙太小,会增加交易次数和手续费支付。这会对最终盈利造成一定影响。可以适当加大移动平均线周期来控制这种风险。
优化方向
该策略还存在进一步优化的空间:
增加止损机制。建立移动止损或时间止损,有助于及时止损,控制单笔损失。
增加仓位管理。如建立加仓和减仓规则,让盈利有加,亏损有减。这可以提高策略收益率。
结合其他指标过滤信号。如KDJ,MACD等指标都可以作为辅助判断信号的指标。这有助于进一步提升策略盈利率。
优化参数设置。可以通过更系统的方法如遗传算法对参数组合进行测试,寻找更佳的参数设置。
总结
玻尔波带波动信号策略整合了移动平均线的趋势判断和超买超卖判定。它根据波带范围变化调整交易频率,可以适应市场的不同状态。同时结合RSI等指标进行信号过滤,避免错误交易。该策略既考虑了追踪市场趋势的需要,也控制了风险。通过持续优化,该策略可以成为稳定盈利的量化交易策略。
/*backtest
start: 2023-01-08 00:00:00
end: 2024-01-14 00:00:00
period: 1d
basePeriod: 1h
exchanges: [{"eid":"Futures_Binance","currency":"BTC_USDT"}]
*/

//@version=5
//@FiboBuLL

strategy(shorttitle='FB Wave', title='FiboBuLL Wave', overlay=true, pyramiding=1, currency=currency.NONE, initial_capital=100000, default_qty_type=strategy.percent_of_equity, default_qty_value=100)

src = input(close, title='Source')
length = input.int(55, minval=1, title='EMA length')  // 20 for classis Bollinger Bands SMA line (basis)


mult = input.float(1., minval=0.236, maxval=2, title='Standard Deviation')  //2 for Classic Bollinger Bands //Maxval = 2 as higher the deviation, higher the risk
basis = ta.sma(src, length)
dev = mult * ta.stdev(src, length)

Show = input.string('Both', options=['Longs Only', 'Shorts Only', 'Both'], title='Trade Type')
CC = input(true, 'Color Bars')

upper = basis + dev
lower = basis - dev

//Conditions for Long and Short - Extra filter condition can be used such as RSI or CCI etc.

short = src < lower  // and rsi(close,14)<40
long = src > upper  // and rsi(close,14)>60

L1 = ta.barssince(long)
S1 = ta.barssince(short)

longSignal = L1 < S1 and not (L1 < S1)[1]
shortSignal = S1 < L1 and not (S1 < L1)[1]

//Plots and Fills


////Long/Short shapes with text
// plotshape(S1<L1 and not (S1<L1)[1]?close:na, text = "sᴇʟʟ", textcolor=#ff0100, color=#ff0100, style=shape.triangledown, size=size.small, location=location.abovebar, transp=0, title = "SELL", editable = true)
// plotshape(L1<S1 and not (L1<S1)[1]?close:na, text = "ʙᴜʏ", textcolor = #008000, color=#008000, style=shape.triangleup, size=size.small, location=location.belowbar, transp=0, title = "BUY", editable = true)

// plotshape(shortSignal?close:na, color=#ff0100, style=shape.triangledown, size=size.small, location=location.abovebar, transp=0, title = "Short Signal", editable = true)
// plotshape(longSignal?close:na, color=#008000, style=shape.triangleup, size=size.small, location=location.belowbar, transp=0, title = "Long Signal", editable = true)


p1 = plot(upper, color=color.new(#ff0000, 75), display=display.all, title='Upper Band')
p2 = plot(lower, color=color.new(#008000, 75), display=display.all, title='Lower Band')

p = plot(basis, color=L1 < S1 ? #008000 : S1 < L1 ? #ff0000 : na, linewidth=2, editable=false, title='Basis')

fill(p, p1, color=color.new(color.teal, 85), title='Top Fill')  //fill for basis-upper
fill(p, p2, color=color.rgb(217, 161, 161), title='Bottom Fill', transp=85)  //fill for basis-lower

//Barcolor

bcol = src > upper ? color.new(#8ceb07, 0) : src < lower ? color.new(#ff0000, 0) : src > basis ? color.green : src < basis ? color.red : na

barcolor(CC ? bcol : na, editable=false, title='Color Bars')


// //Alerts ----  // Use 'Once per bar close'

// alertcondition(condition=longSignal, title="Long - BB Filter", message='BB Filter Long @ {{close}}') // Use 'Once per bar close'
// alertcondition(condition=shortSignal, title="Short - BB Filter", message='BB Filter Short @ {{close}}')  // Use 'Once per bar close'

Notestart1 = input(true, '╔═══ Time Range to BackTest ═══╗')

// === INPUT BACKTEST RANGE ===
FromMonth = input.int(defval=1, title='From Month', minval=1, maxval=12)
FromDay = input.int(defval=1, title='From Day', minval=1, maxval=31)
FromYear = input.int(defval=2018, title='From Year', minval=2015)
ToMonth = input.int(defval=1, title='To Month', minval=1, maxval=12)
ToDay = input.int(defval=1, title='To Day', minval=1, maxval=31)
ToYear = input.int(defval=9999, title='To Year', minval=2010)

// === FUNCTION EXAMPLE ===
start = timestamp(FromYear, FromMonth, FromDay, 00, 00)  // backtest start window
finish = timestamp(ToYear, ToMonth, ToDay, 23, 59)  // backtest finish window
window() =>
    time >= start and time <= finish ? true : false

if window() and (Show == 'Longs Only' or Show == 'Both')
    strategy.entry('AL', direction=strategy.long, when=longSignal)
    strategy.close('LongAL', when=shortSignal, comment='AL KAPA')

if window() and (Show == 'Shorts Only' or Show == 'Both')
    strategy.entry('SAT', direction=strategy.short, when=shortSignal)
    strategy.close('SAT', when=longSignal, comment='SAT KAPA')