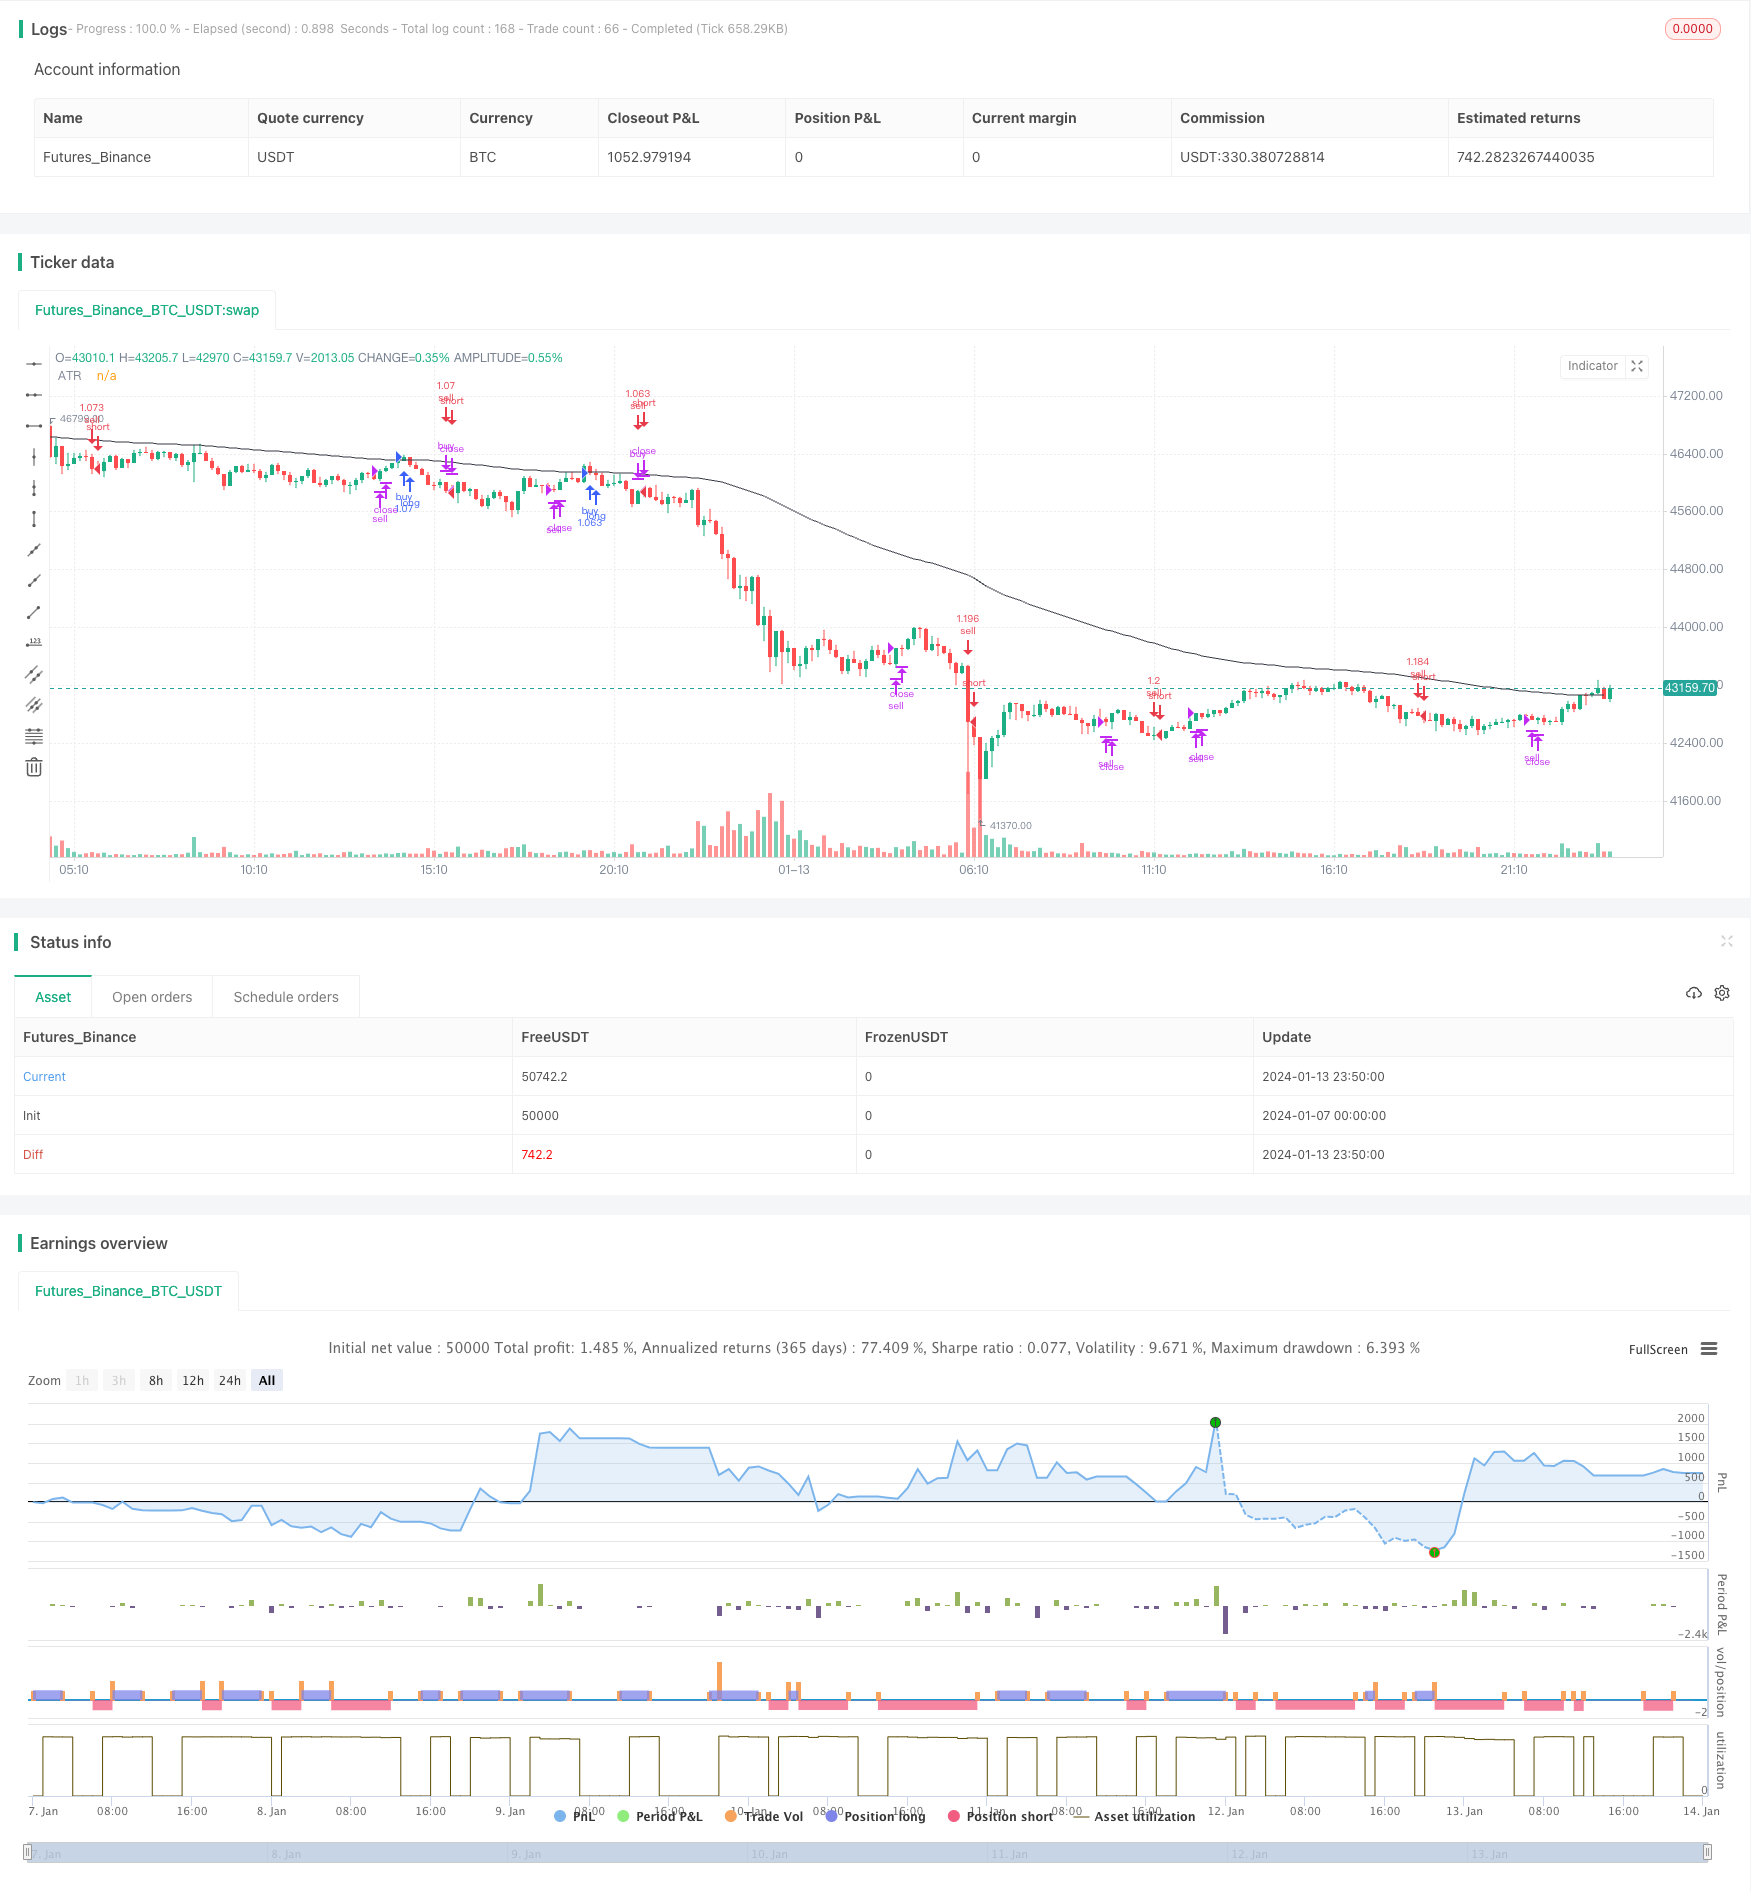
概述
本策略的核心思想是结合 Hull 均线和真实波幅(ATR)来识别市场趋势方向,并在趋势方向确认后进行入场。具体来说,是计算一定周期内的 Hull 均线和前一周期的 Hull 均线之间的差值,当差值上升时判断为看涨趋势,差值下降时判断为看跌趋势。同时结合 ATR 指标判断幅度,在趋势方向确认的同时波幅不断扩大的时候 choose 入场。
策略原理
本策略主要基于 Hull 均线和 ATR 两类指标。
Hull 均线是由美国期货交易员 Alan Hull 开发的一个趋势跟踪型指标。Hull 均线类似于移动平均线,但是 Hull 均线具有更高的灵敏度,可以更快速地捕捉价格变化趋势。策略中设置了一个可调参数 hullLength 来控制 Hull 均线的周期长度,通过计算当前周期和前一周期的 Hull 均线之间的差值,来判断目前的价格趋势方向。
ATR 即 Average True Range,也就是真实波幅。它反映了每日价格波动的幅度。当波动加大时,真实波幅就会上升;当波动减小时,真实波幅就会下降。策略中设置了 atrLength、atrSmoothing 等参数来控制 ATR 的计算方式。并将其画在图表上,作为入场的指标之一。
具体来说,策略逻辑是:
- 计算当前周期(hullLength 设置)的 Hull 均线 currentHullMA 和前一周期的 Hull 均线 previousHullMA
- 计算两者的差值 hullDiff = currentHullMA - previousHullMA
- 当 hullDiff > 0 时,判断为多头趋势;当 hullDiff < 0 时,判断为空头趋势
- 同时,计算一定周期(atrLength 设置)的 ATR 值,作为趋势的幅度指标
- 当判断为多头趋势,且 ATR 值大于 price 且 price 大于 atrLength 周期前的价格时,做多;当判断为空头趋势,且 ATR 值小于 price 且 price 小于 atrLength 周期前的价格时,做空
- 通过 hullDiff 的正负来判断平仓信号
策略优势分析
本策略具有如下优势:
- 结合趋势判断和波动率指标,可以在价格趋势明确且波动加大时选择入场,避免在震荡市中被套。
- Hull 均线对价格变化的响应更为敏感,可以快速判断新的趋势方向。
- ATR 能反映市场波动性和热度,为入场时间点的选择提供依据。
- 可调参数较多,可以通过优化得到最佳参数组合。
风险分析
本策略也存在一些风险:
- Hull 均线和 ATR 都无法完全避免假突破的问题,仍有可能被套。
- 参数设置不当可能导致交易频繁或不够敏感,从而影响策略效果。
- 无法有效应对剧烈行情,如快速拉升突破或暴跌。
对应解决方法:
- 适当宽松止损,避免被突破套牢。
- 通过反复测试优化参数,使指标更符合不同市场环境。
- 在剧烈行情来临时,暂停策略运行。
优化方向
本策略的优化空间还比较大,主要可以从以下几个方面入手:
- 测试不同的 Hull 均线周期参数,找到最适合当前市场环境的周期设置。
- 测试不同的 ATR 周期参数组合,找到最能抓住行情热度的周期。
- 尝试不同类型的 ATR 平滑方式(RMA、SMA、EMA等),看哪种方式效果最佳。
- 优化开仓条件,比如结合波动指标 Reaction 和 ATR 的组合条件判断。
- 优化止损方式,适当放宽止损幅度,避免被套。
总结
本策略整合运用 Hull 均线的趋势跟踪能力和 ATR 的热度指标判断能力,在确认趋势的同时选择波动较大而积极的时间点入场,可以过滤掉一些无效信号。指标参数的优化和风险管理手段的使用可以进一步增强策略的效果。总的来说,本策略结合了趋势跟踪和热度判断的多种因素,在参数调整和优化到位的情况下,可以获得较好的效果。
策略源码
/*backtest
start: 2024-01-07 00:00:00
end: 2024-01-14 00:00:00
period: 10m
basePeriod: 1m
exchanges: [{"eid":"Futures_Binance","currency":"BTC_USDT"}]
*/

//@version=3
//                                                Hull cross and ATR
strategy("Hull cross and ATR", shorttitle="H&ATR", overlay=true, default_qty_type=strategy.percent_of_equity, default_qty_value=100, calc_on_order_fills=true, calc_on_every_tick=true, pyramiding=0)
keh=input(title="Hull Length",defval=50)
length = input(title="ATR Length", defval=50, minval=1)
smoothing = input(title="ATR Smoothing", defval="RMA", options=["RMA", "SMA", "EMA", "WMA"])
p=input(ohlc4,title="Price data")
n2ma=2*wma(p,round(keh/2))
nma=wma(p,keh)
diff=n2ma-nma
sqn=round(sqrt(keh))
n2ma1=2*wma(p[1],round(keh/2))
nma1=wma(p[1],keh)
diff1=n2ma1-nma1
sqn1=round(sqrt(keh))
n1=wma(diff,sqn)
n2=wma(diff1,sqn)
ma_function(source, length) =>
    if smoothing == "RMA"
        rma(p, length)
    else
        if smoothing == "SMA"
            sma(p, length)
        else
            if smoothing == "EMA"
                ema(p, length)
            else
                wma(p, length)
plot(ma_function(tr(true), length), title = "ATR", color=black, transp=50)
closelong = n1<n2
if (closelong)
    strategy.close("buy")
closeshort = n1>n2
if (closeshort)
    strategy.close("sell")
if (ma_function(tr(true), length)<p and p>p[length] and n1>n2)
    strategy.entry("buy", strategy.long, comment="BUY")
if (ma_function(tr(true), length)>p and p<p[length] and n1<n2)
    strategy.entry("sell", strategy.short, comment="SELL")