概述
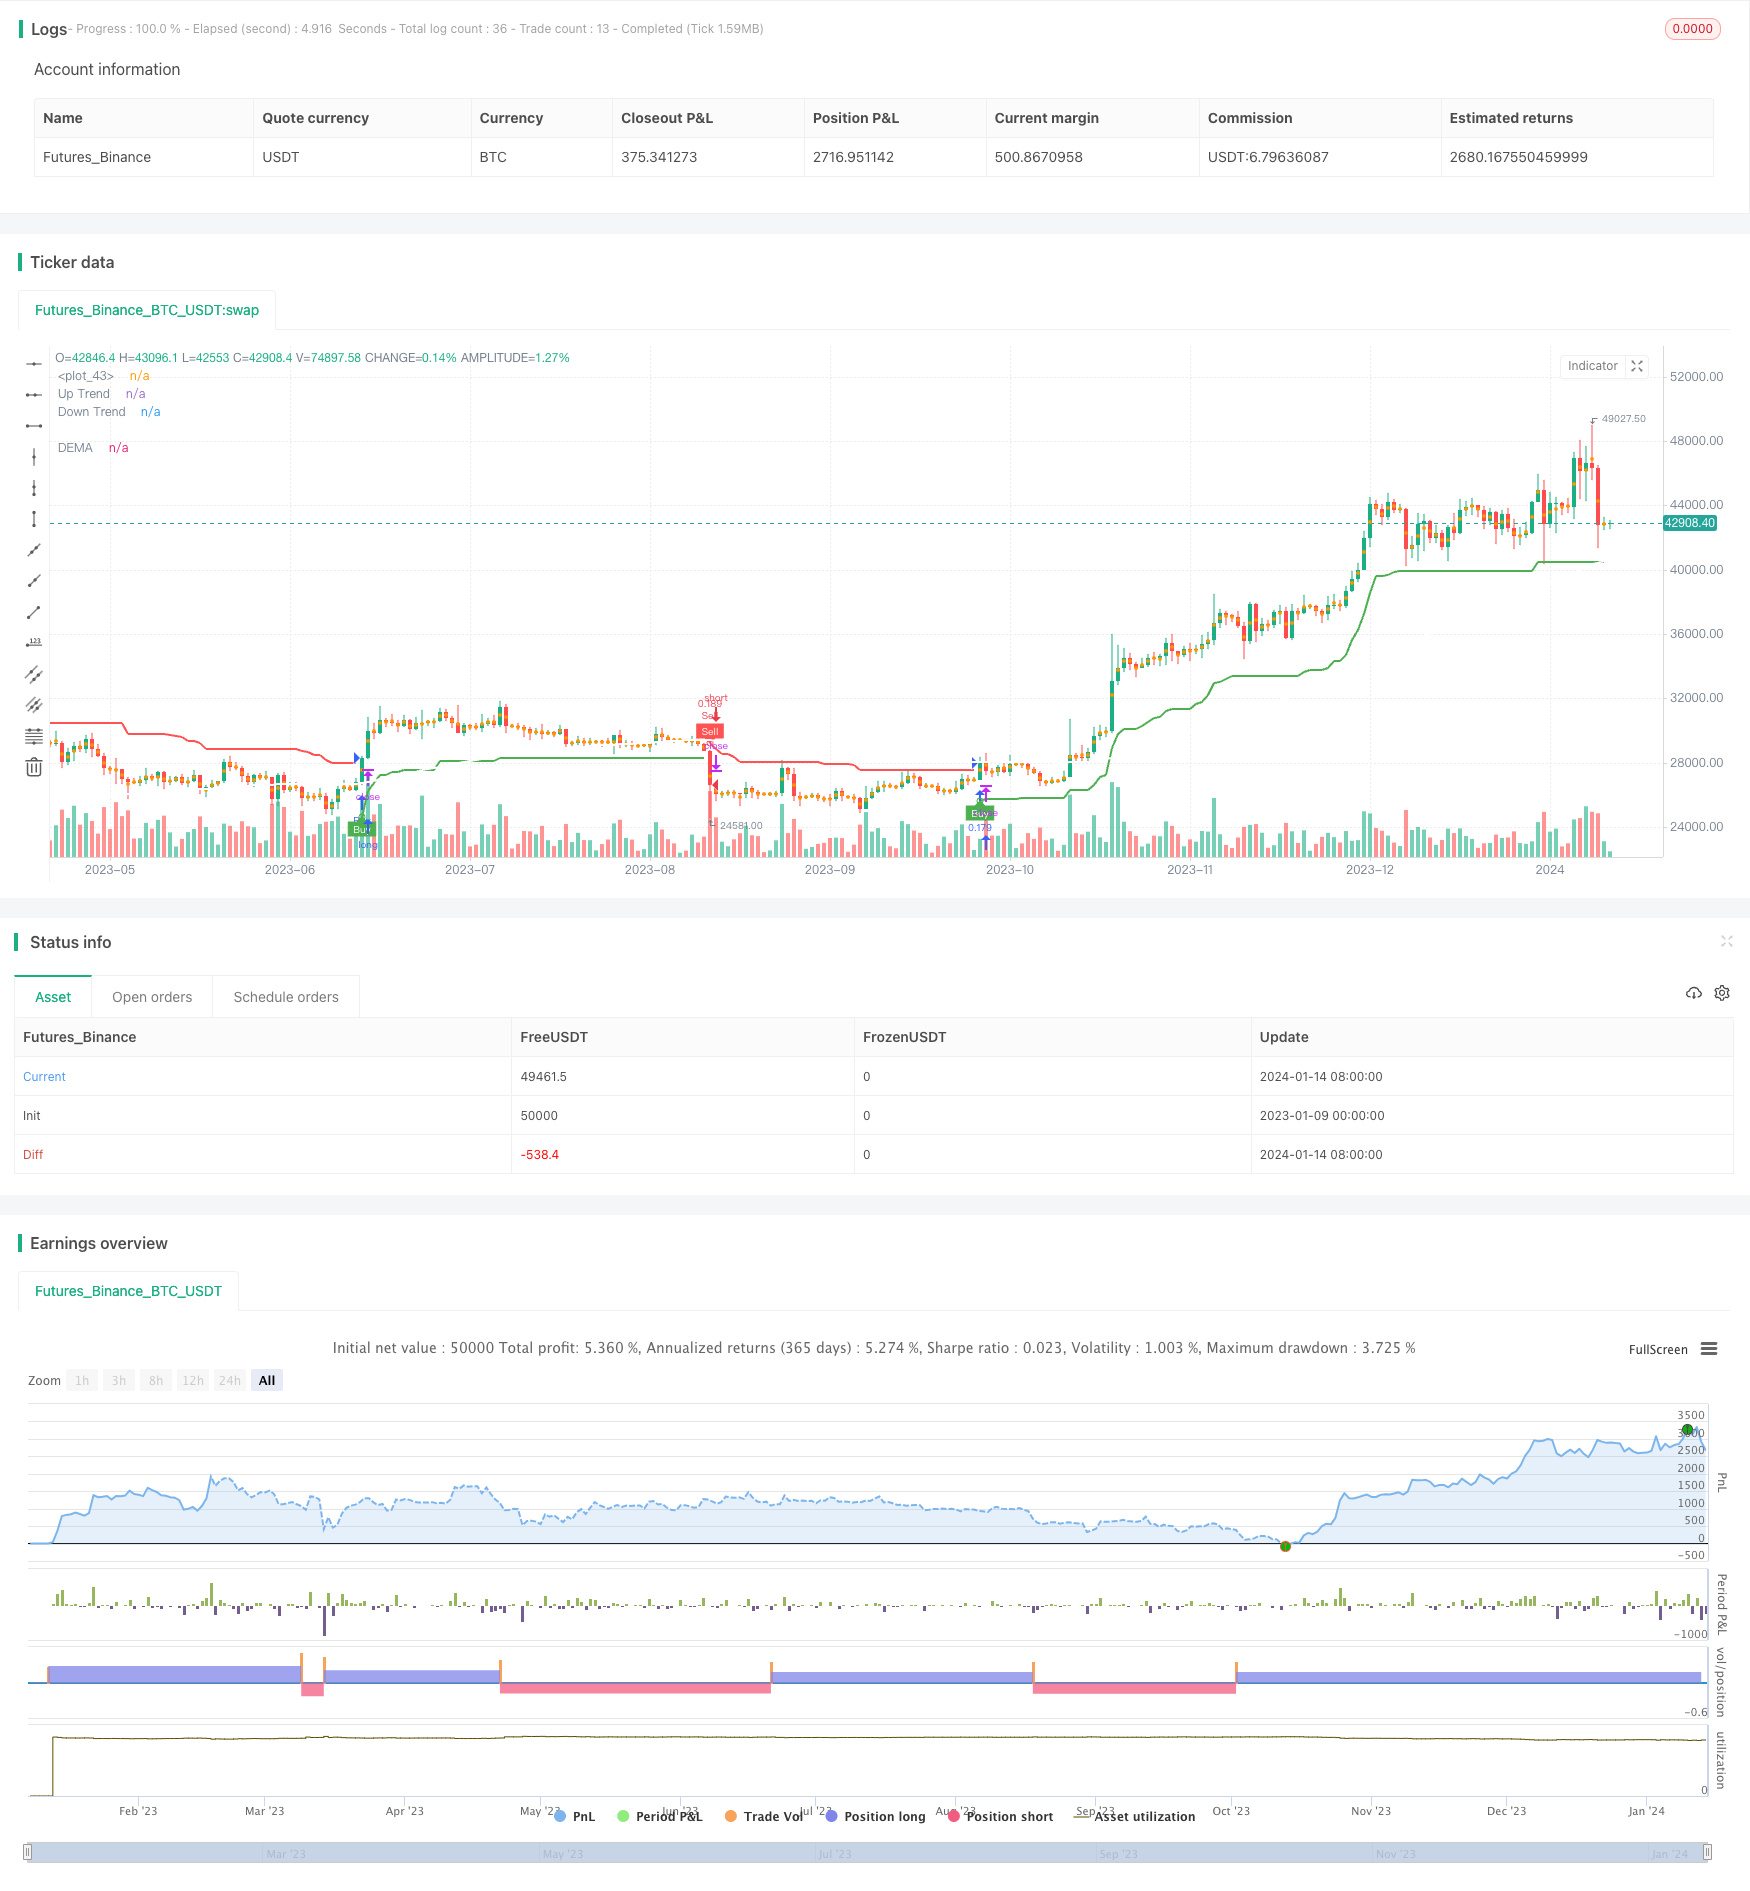
双重趋势追踪策略是一个结合超级趋势指标、双指数移动平均线(DEMA)和布林带的复合策略。它旨在利用多种技术指标的优势,在趋势反转时及时捕捉买卖信号。
策略原理
该策略主要由三个部分组成:
超级趋势指标:计算向上突破线和向下突破线,判断目前的趋势方向。当价格从下向上突破超级趋势线时生成买入信号;从上向下突破时生成卖出信号。
双指数移动平均线(DEMA):一种趋势跟踪指标,结合了简单移动平均线和指数移动平均线的特点,能更快地响应价格变动。策略中设置200日的DEMA,用来判断长期趋势方向。
布林带:表示价格波动的范围。布林带异常收缩或扩张时,预示着可能的趋势反转。
当超级趋势指标和DEMA都发出买入/卖出信号时,即进入相应的仓位。此外,布林带的异常也可作为辅助判断的信号。
策略优势
- 多指标组合,综合判断,减少假信号。
- 超级趋势指标对细小价格变动不敏感,只在趋势转折点产生信号,避免过于频繁交易。
- DEMA平滑曲线,判断长期趋势准确可靠。
- 布林带辅助判断趋势反转点。
风险及解决方法
- 超级趋势指标参数设置过于灵敏,可能产生较多噪音。可调整ATR周期和倍数参数实现优化。
- DEMA周期过长追随趋势能力差。可以测试缩短至100天等参数。
- 多指标组合判断时信号不一致的情况。这时可遵循超级趋势指标为主信号。
优化方向
- 测试不同的ATR周期和倍数参数设定,找到超级趋势指标最佳参数。
- 优化DEMA周期参数。
- 添加其他指标辅助判断,如KDJ、MACD等。
- 增加止损策略。
总结
双重趋势追踪策略多指标组合,综合利用超级趋势、DEMA和布林带三者的优势,在抓取趋势的同时提高信号质量,通过参数优化可期望获得更好的策略效果。止损机制的添加也是未来的优化重点。
策略源码
/*backtest
start: 2023-01-09 00:00:00
end: 2024-01-15 00:00:00
period: 1d
basePeriod: 1h
exchanges: [{"eid":"Futures_Binance","currency":"BTC_USDT"}]
*/

//@version=4
strategy("Supertrend + DEMA + Bollinger Bands", overlay=true, default_qty_type=strategy.percent_of_equity, default_qty_value=10, precision=2)

// Input parameters for Supertrend
atrLength = input(title="ATR Period", type=input.integer, defval=12)
src = input(hl2, title="Source")
multiplier = input(title="ATR Multiplier", type=input.float, step=0.1, defval=3.0)
changeATR = input(title="Change ATR Calculation Method?", type=input.bool, defval=true)
showSupertrend = input(title="Show Supertrend Indicator?", type=input.bool, defval=true)

// Input parameters for DEMA
demaLength = input(200, title="DEMA Period")
showDEMA = input(title="Show DEMA Indicator?", type=input.bool, defval=true)

// Calculate ATR for Supertrend
atr2 = sma(tr, atrLength)
atr = changeATR ? atr(atrLength) : atr2

// Calculate Supertrend
up = src - (multiplier * atr)
up1 = nz(up[1], up)
up := close[1] > up1 ? max(up, up1) : up

dn = src + (multiplier * atr)
dn1 = nz(dn[1], dn)
dn := close[1] < dn1 ? min(dn, dn1) : dn

trend = 1
trend := nz(trend[1], trend)
trend := trend == -1 and close > dn1 ? 1 : trend == 1 and close < up1 ? -1 : trend

// Plot Supertrend
upPlot = plot(showSupertrend ? (trend == 1 ? up : na) : na, title="Up Trend", style=plot.style_linebr, linewidth=2, color=color.new(color.green, 0))
buySignal = trend == 1 and trend[1] == -1
plotshape(buySignal ? up : na, title="UpTrend Begins", location=location.absolute, style=shape.circle, size=size.tiny, color=color.new(color.green, 0))
plotshape(buySignal ? up : na, title="Buy", text="Buy", location=location.absolute, style=shape.labelup, size=size.tiny, color=color.new(color.green, 0), textcolor=color.new(color.white, 0))

dnPlot = plot(showSupertrend ? (trend == 1 ? na : dn) : na, title="Down Trend", style=plot.style_linebr, linewidth=2, color=color.new(color.red, 0))
sellSignal = trend == -1 and trend[1] == 1
plotshape(sellSignal ? dn : na, title="DownTrend Begins", location=location.absolute, style=shape.circle, size=size.tiny, color=color.new(color.red, 0))
plotshape(sellSignal ? dn : na, title="Sell", text="Sell", location=location.absolute, style=shape.labeldown, size=size.tiny, color=color.new(color.red, 0), textcolor=color.new(color.white, 0))

mPlot = plot(ohlc4, title="", style=plot.style_circles, linewidth=0)

longFillColor = (trend == 1 ? color.new(color.green, 80) : color.new(color.white, 0))
shortFillColor = (trend == -1 ? color.new(color.red, 80) : color.new(color.white, 0))

fill(mPlot, upPlot, title="UpTrend Highlighter", color=longFillColor)
fill(mPlot, dnPlot, title="DownTrend Highlighter", color=shortFillColor)

// Alert conditions
alertcondition(buySignal, title="Custom Supertrend Buy", message="Custom Supertrend Buy!")
alertcondition(sellSignal, title="Custom Supertrend Sell", message="Custom Supertrend Sell!")

// Calculate DEMA
ema1 = ema(close, demaLength)
dema = 2 * ema1 - ema(ema1, demaLength)

// Plot DEMA with white color
plot(showDEMA ? dema : na, color=color.new(color.white, 0), title="DEMA", linewidth=2)

// Add push notification on mobile if buy and sell occurred
if (buySignal)
    strategy.entry("Buy", strategy.long)
    strategy.exit("Sell")
    alert("Buy Signal - Supertrend")

if (sellSignal)
    strategy.entry("Sell", strategy.short)
    strategy.exit("Cover")
    alert("Sell Signal - Supertrend")