Type/to search

WaveTrend and DER Based Swing Trading Strategy

Common strategy
Created: 2024-01-16 15:13:28
Last modified: 3 years ago
1
Follow
1802
Followers

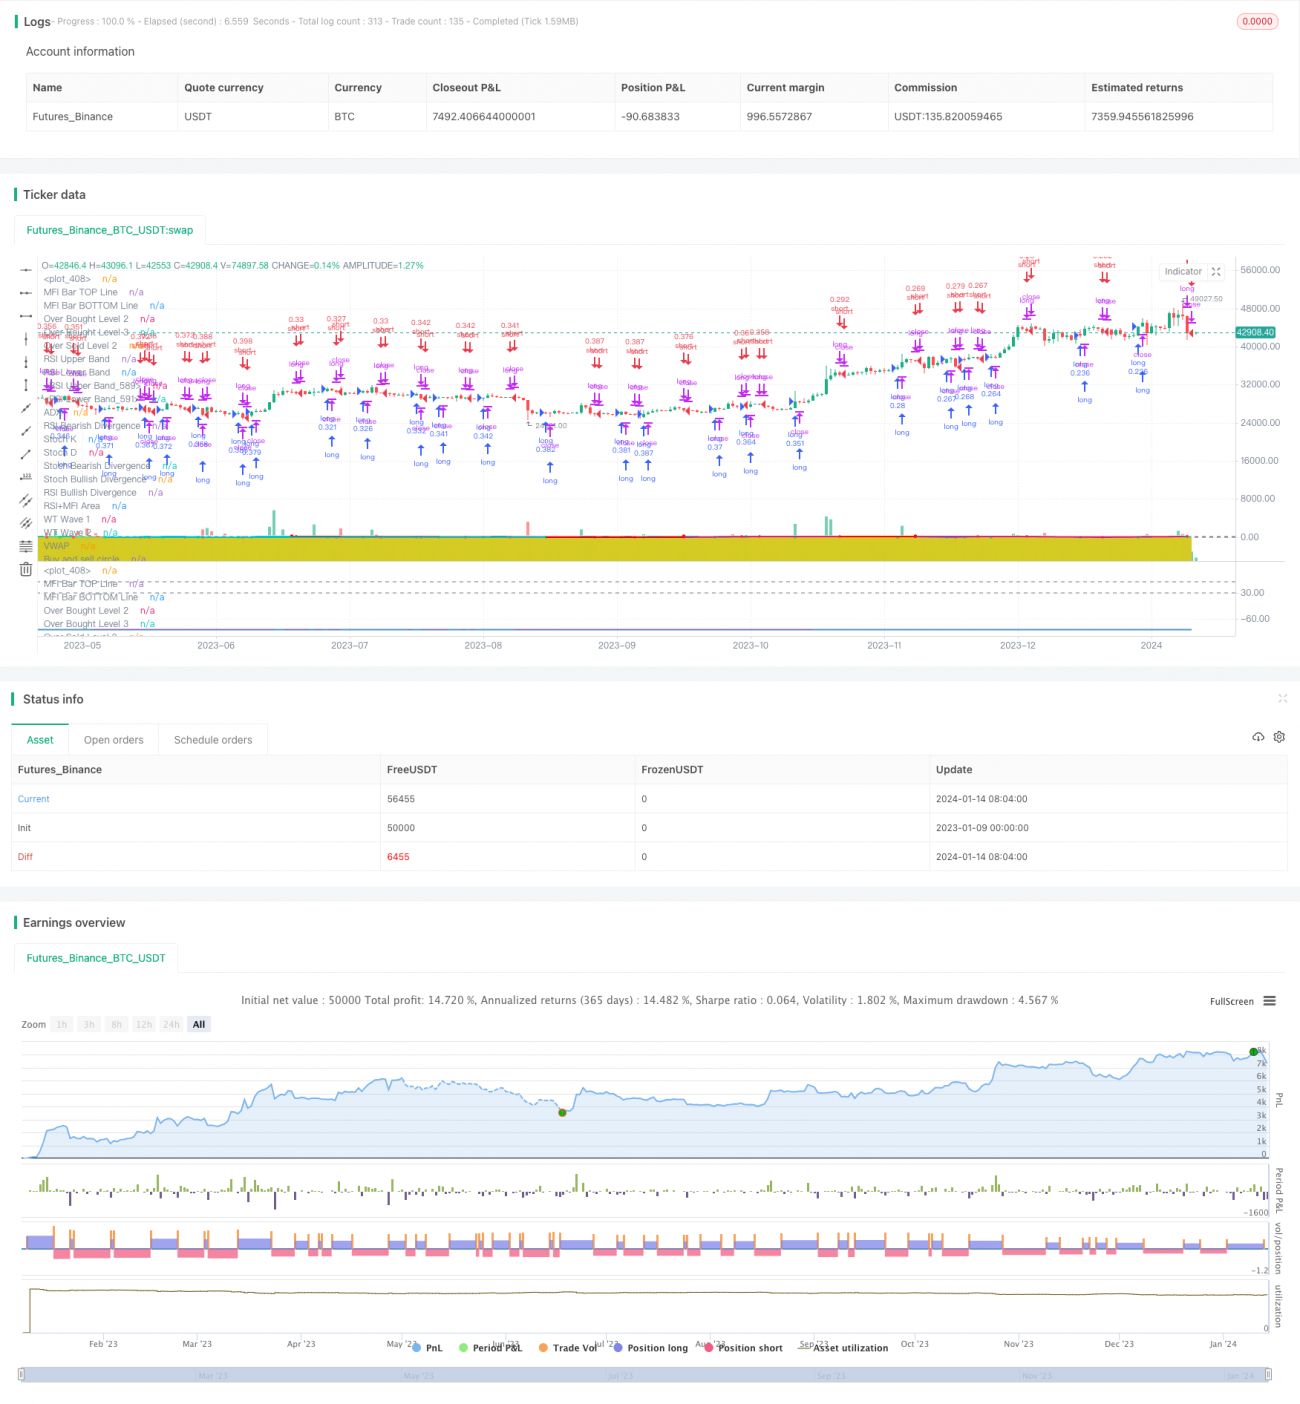
img

Overview

This strategy combines indicators like Relative Strength Index (RSI), Directional Movement System and Directional Energy Ratio (DER) to precisely track market swings and capture short-term trend opportunities.

Strategy Logic

The core logic utilizes WaveTrend indicator to determine price fluctuation and direction, cooperating with the RSI indicator to judge overbought and oversold conditions, as well as the custom DER indicator to estimate the momentum of price movements, in order to decide long/short directions.

Specifically, when the second WaveTrend average wt2 crosses above the first average wt1, it is a long signal. At this moment, if DER > 0 indicating an upward trend, a long position will be opened. When wt2 crosses below wt1, it is a short signal. At this moment, if DER < 0 showing a downward trend, a short position will be opened.

In addition, RSI indicator is used to detect extreme overbought/oversold status. If RSI goes above 70 showing overbought condition, existing long positions may be closed. If RSI goes below 30 showing oversold condition, existing short positions may be closed.

Advantages

  1. WaveTrend indicator determines price fluctuation and direction shift more precisely compared to single moving average lines.

  2. The custom DER indicator judges the momentum and direction of price movements, avoiding whipsaws in sideways markets.

  3. RSI indicator helps set proper stops when overbought/oversold.

  4. The strategy has fast response and strong manipulation capability for short-term trends.

Risk Analysis

  1. Multiple parameters are used in this strategy and need optimization, which may affect performance if set inappropriately.

  2. The strategy mainly targets short-term swings and may underperform in lasting trending markets.

  3. It is sensitive to trading fees and commissions. Exchanges with lower commissions should be chosen.

  4. Major news events are not considered which may cause drawdowns.

Enhancement Directions

  1. Introduce machine learning algorithms to auto-optimize parameters.

  2. Employ more position sizing and risk management techniques.

  3. Incorporate analysis of longer-term trends using moving averages to determine overall entries and exits.

  4. Consider capabilities in risk detection related to impactful news events.

Conclusion

This strategy leverages multiple technical indicators to track short-term oscillations and achieve low-risk market manipulation, fitting for capturing medium and short-term opportunities. Further improvements on parameter tuning, position sizing, integrating more factors can lead to better drawdown controls and overall performance.

Source
Pine
/*backtest
start: 2023-01-09 00:00:00
end: 2024-01-15 00:00:00
period: 1d
basePeriod: 1h
exchanges: [{"eid":"Futures_Binance","currency":"BTC_USDT"}]
*/

// This source code is subject to the terms of the Mozilla Public License 2.0 at https://mozilla.org/MPL/2.0/
// © vumanchu

//@version=4
Strategy parameters
Strategy parameters
Show WaveTrend
Show Buy dots
Show Gold dots
Show Sell dots
Show Div. dots
Show Fast WT
WT Channel Length
WT Average Length
WT MA Source
WT MA Length
WT Overbought Level 1
WT Overbought Level 2
WT Overbought Level 3
WT Oversold Level 1
WT Oversold Level 2
WT Oversold Level 3
Show WT Regular Divergences
Show WT Hidden Divergences
Not apply OB/OS Limits on Hidden Divergences
WT Bearish Divergence min
WT Bullish Divergence min
Show 2nd WT Regular Divergences
WT 2nd Bearish Divergence
WT 2nd Bullish Divergence 15 min
Show MFI
MFI Period
MFI Area multiplier
MFI Area Y Pos
Show RSI
RSI Source
RSI Length
RSI Oversold
RSI Overbought
Show RSI Regular Divergences
Show RSI Hidden Divergences
RSI Bearish Divergence min
RSI Bullish Divergence min
Show Stochastic RSI
Use Log?
Use Average of both K & D
Stochastic RSI Source
Stochastic RSI Length
RSI Length
Stochastic RSI K Smooth
Stochastic RSI D Smooth
Show Stoch Regular Divergences
Show Stoch Hidden Divergences
Show Schaff TC line
Schaff TC Source
Schaff TC
Schaff TC Fast Lenght
Schaff TC Slow Length
Schaff TC Factor
Show Sommi flag
Show Sommi F. Wave
Sommi F. Wave timeframe
F. Wave Bear Level (less than)
F. Wave Bull Level (more than)
WT Bear Level (more than)
WT Bull Level (less than)
Money flow Bear Level (less than)
Money flow Bull Level (more than)
Show Sommi diamond
HTF Candle Res. 1
HTF Candle Res. 2
WT Bear Level (More than)
WT Bull Level (Less than)
Show MACD Colors
MACD Colors MACD TF
Dark mode
len
th
length
RSI Settings
RSI Length
Source
RSI Length
Source
Directional Energy Ratio
Average
Smoothing
Volume Parameters
Calculation
Lookback (for Relative)
Comment
All comments (0)
No data
No data
  • 1
Forums
PINE Language
Get the app
iPhone Download
© 2015 - ∞ INVENTOR PTE LTD (SG)