概述
线性回归通道策略是一种基于线性回归分析和均线指标的短线交易策略。该策略结合了线性回归通道和Hull移动平均线,目的是识别趋势方向,找到较低风险的入市点。
策略原理
线性回归通道策略主要基于两个指标:
线性回归通道(Linear Regression Channel):通过线性回归分析计算得到的通道范围。策略中设置了长度为55天的线性回归线,代表价格的长期趋势。同时计算通道上限线,代表热度较高的价格区域。
Hull移动平均线(Hull Moving Average):一种类似移动平均线的趋势跟踪指标,长度设置为400天,用来判断价格总体走势和方向。
具体交易逻辑是:
当价格低于通道上限线,并且低于400天Hull移动平均线时,做多;当价格重新回升到线性回归中线上方时,平仓止盈。
这样可以在盘整期间买入低点,并在价格重新进入上升通道时套现获利。
优势分析
这种策略具有以下几点优势:
线性回归通道可以较准确判断价格热度和长期趋势方向,避免在震荡行情中盲目入场。
Hull移动平均线过滤了短期市场噪音,让入场时机更为明确。
策略操作频率较低,回撤风险较小。不会在市场震荡时追高杀跌。
获利点清晰,通常能在中短线行情中获取不错收益。
风险分析
线性回归通道策略也存在一些风险:
在牛市中,线性回归通道可能走平或者微弱下跌,导致错过buying opportunities。可通过适当调整参数优化。
突发事件造成重大调整时,止损线可能被突破,产生较大亏损。可设置止损线比例以控制单笔损失。
如果回调过深跌破Hull均线,可能无法获利平仓。可调整Hull均线参数或设置止损线。
交易频率可能过于低下。可适当缩短线性回归周期,提高交易频次。
优化方向
线性回归通道策略可从以下几个方面进行优化:
动态调整线性回归通道参数,让通道更贴近实际价格波动。
优化 Hull 均线参数,使其能更好地判断趋势转折点。
在通道内设置追踪止损点,可有效控制单笔亏损风险。
增加波动率指标,避免在震荡剧烈行情中开仓。
结合交易量指标判断真实突破。
总结
线性回归通道策略整体来说是一种较为稳健的趋势跟踪策略。它可以避开市场噪音,在趋势开始时就进入正确方向。通过参数优化和指标组合,可以进一步减少其交易风险,提高获利率。这种策略适合中长线持有,无须频繁操作。总体上,它具有较强的实盘运用价值。
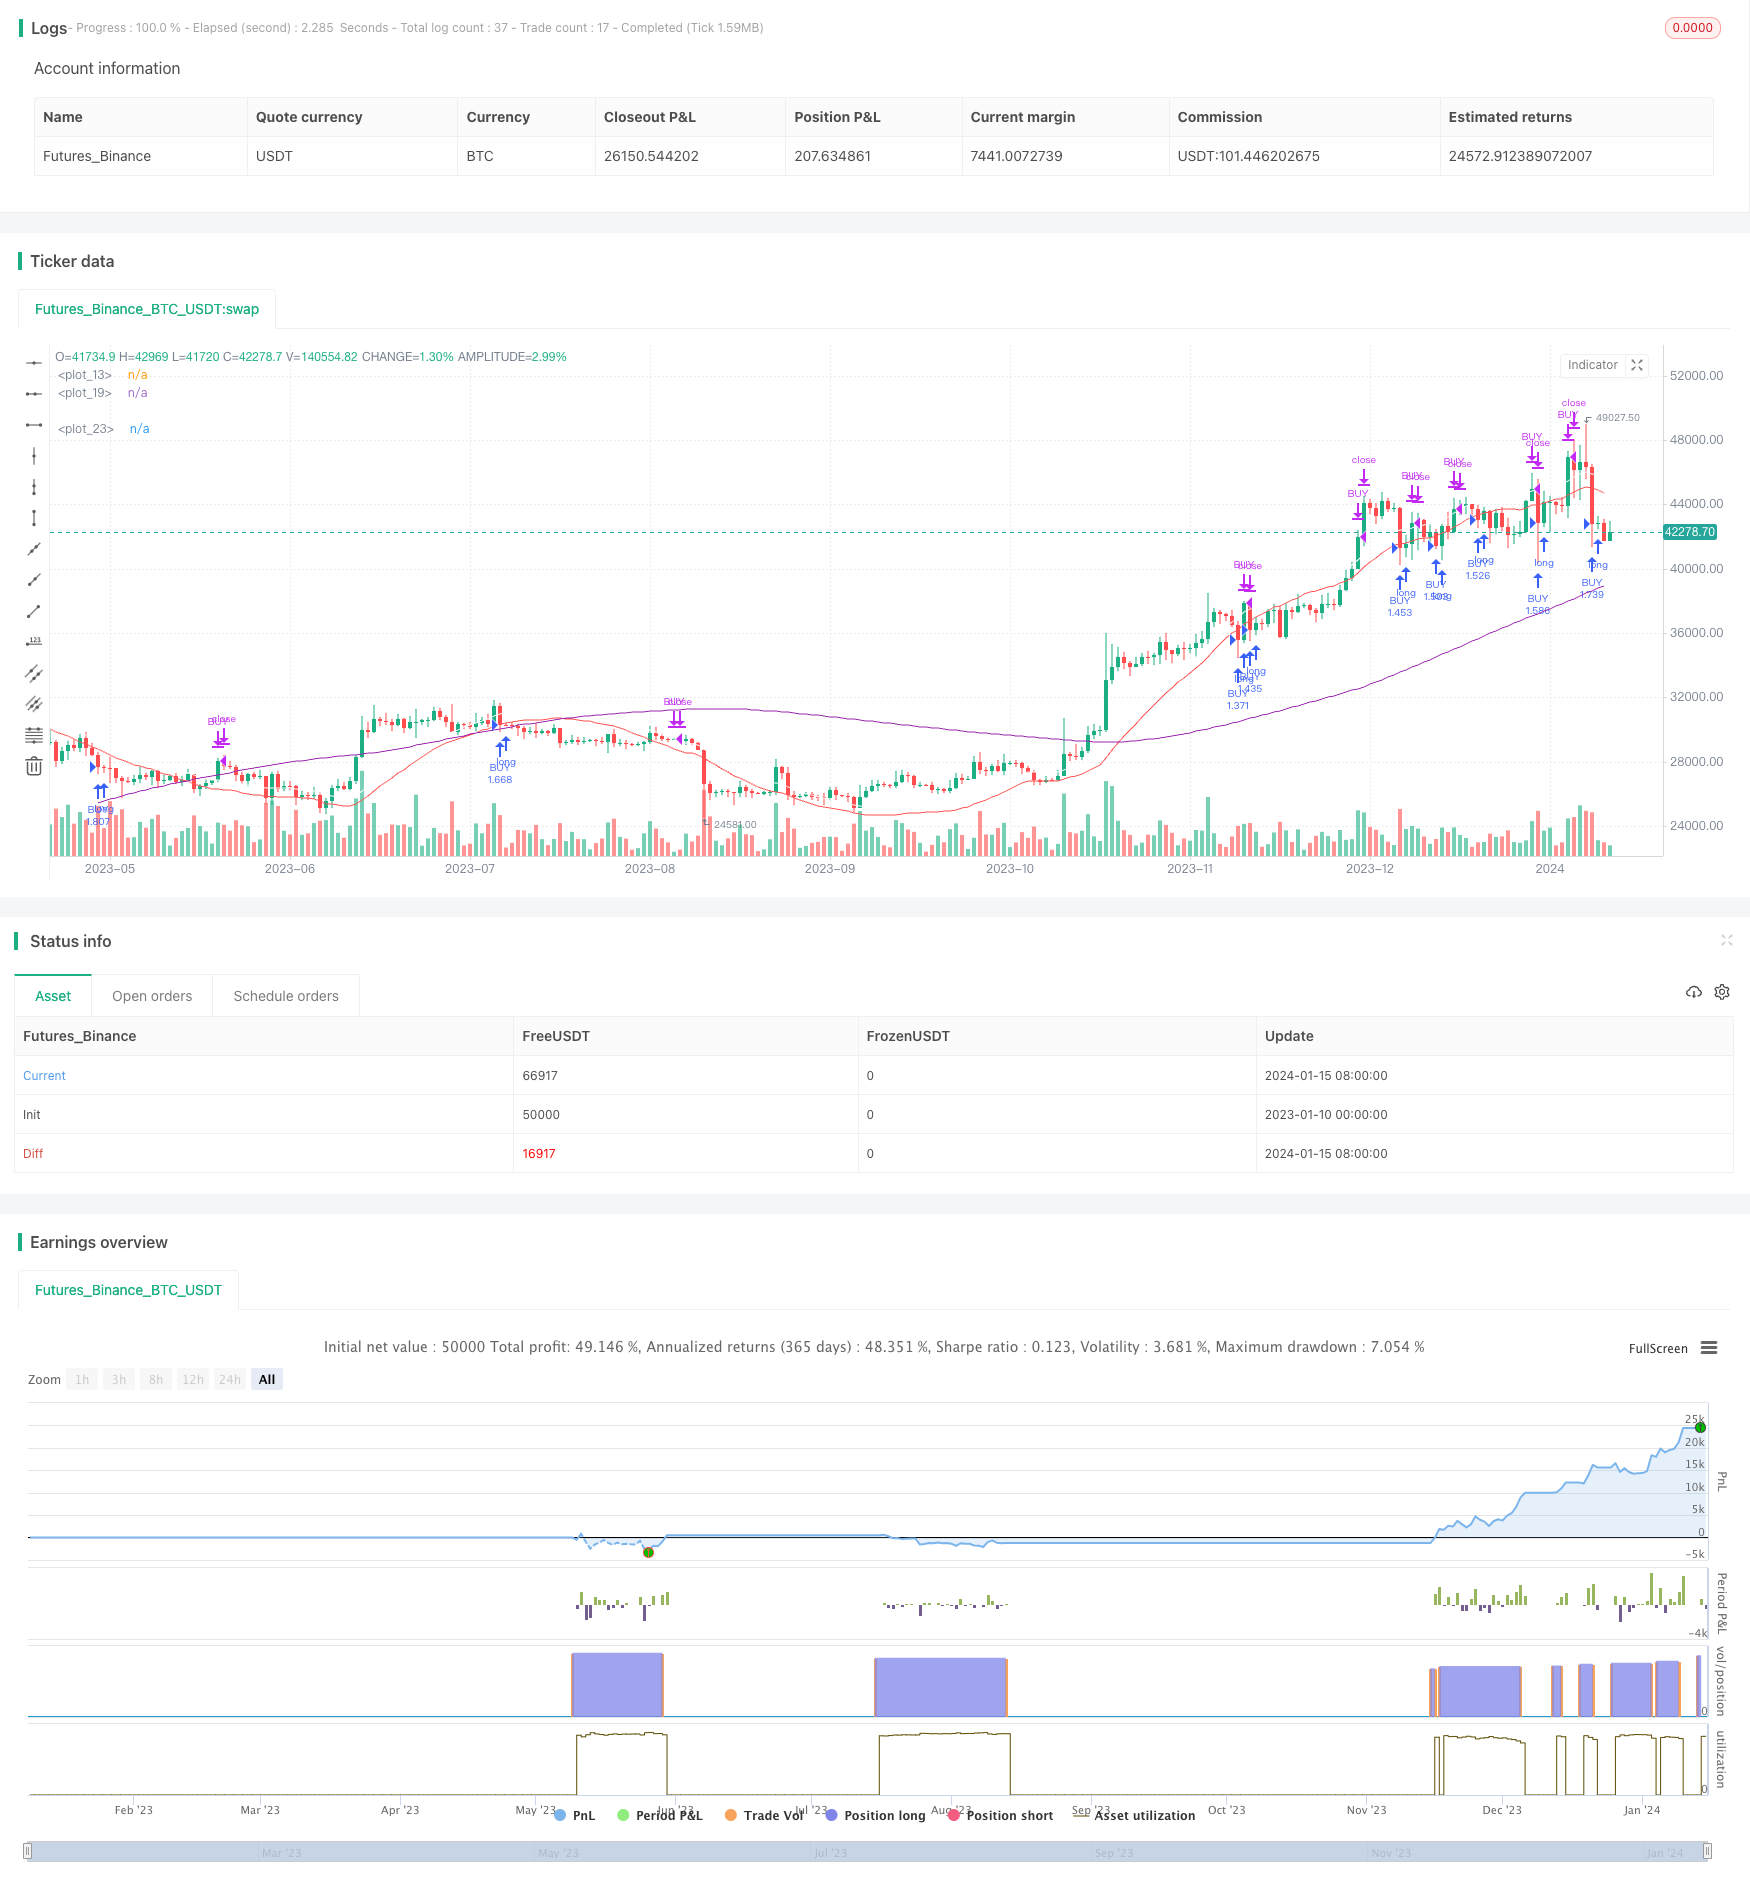
/*backtest
start: 2023-01-10 00:00:00
end: 2024-01-16 00:00:00
period: 1d
basePeriod: 1h
exchanges: [{"eid":"Futures_Binance","currency":"BTC_USDT"}]
*/

// This source code is subject to the terms of the Mozilla Public License 2.0 at https://mozilla.org/MPL/2.0/
// © TradingAmmo

//@version=4
strategy("Linear Channel", overlay=true, default_qty_type=strategy.percent_of_equity, default_qty_value=100, commission_type=strategy.commission.percent, commission_value=0.075, currency='USD')
startP = timestamp(input(2017, "Start Year"), input(12, "Month"), input(17, "Day"), 0, 0)
end   = timestamp(input(9999, "End Year"),  1, 1,  0, 0)
_testPeriod() => true

//linreg
length = input(55)
linreg = linreg(close, length, 0)
plot(linreg, color=color.white)

//calc band
Value = input(-2)
sub = (Value/100)+1
Band2 = linreg*sub
plot(Band2, color=color.red)

//HMA as a filter
HMA = input(400, minval=1)
plot(hma(close, HMA), color=color.purple)

long_condition = close <  Band2  and hma(close, HMA) < close and _testPeriod()
strategy.entry('BUY', strategy.long, when=long_condition)

short_condition =  close > linreg
strategy.close('BUY', when=short_condition)