资源加载中... loading...

Optimized EMA Crossover Strategy

Author: ChaoZhang, Date: 2024-01-17 12:01:59
Tags:

img

Overview

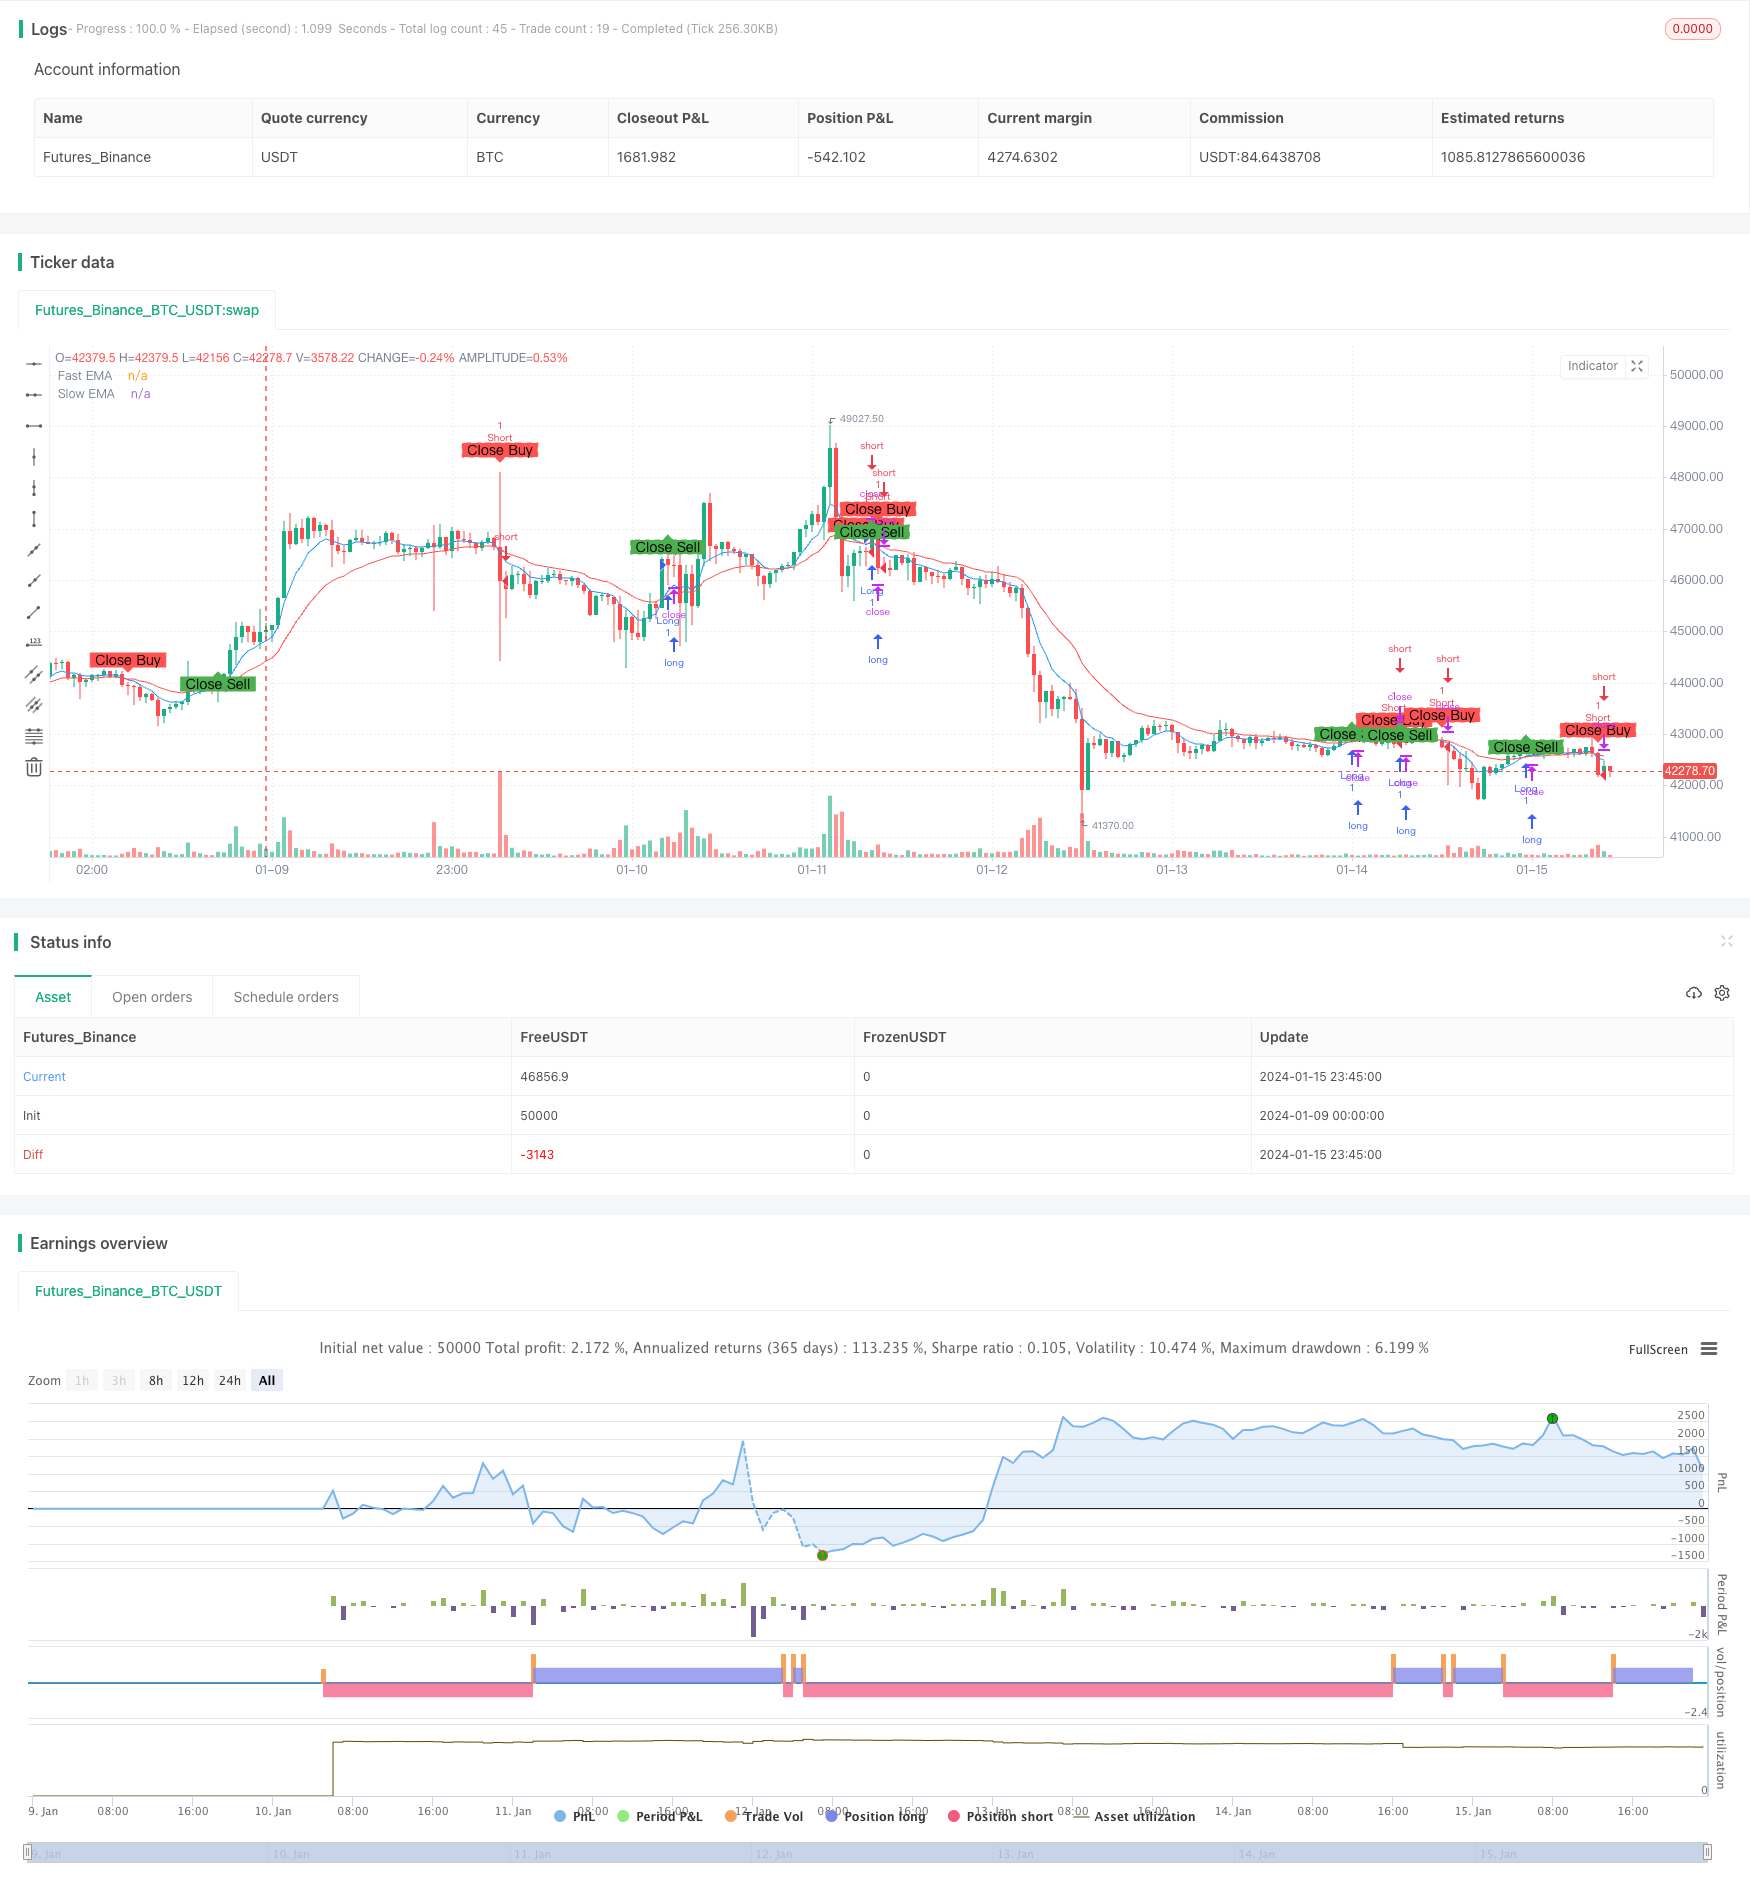
The optimized EMA crossover strategy is a simple yet effective quantitative trading strategy that follows the EMA indicators. It utilizes the crossover between EMAs of different periods as buy and sell signals, combined with position sizing based on risk management principles.

Strategy Name and Logic

The name of the strategy is Optimized EMA Golden Cross Strategy. The word “Optimized” reflects the optimization of parameters and mechanisms based on the basic EMA strategy; “EMA” represents the core indicator Exponential Moving Average; “Golden Cross” refers to the trading signals generated by the golden cross of different EMA lines.

The basic logic is: Calculate two groups of EMAs with different parameters, generate buy signals when the faster EMA crosses above the slower EMA, and generate sell signals when the faster EMA crosses below the slower EMA. The combinations of 7-period and 20-period EMAs are used here, forming the fast line and slow line.

In the code, fastEMA = ema(close, fastLength) and slowEMA = ema(close, slowLength) calculate and plot the 7-day EMA and 20-day EMA. When the fast line crosses above the slow line, i.e. the crossover(fastEMA, slowEMA) condition is true, a buy signal is generated. When the fast line crosses below the slow line, i.e. the crossunder(fastEMA, slowEMA) condition is true, a sell signal is generated.

Advantage Analysis

The Optimized EMA Golden Cross Strategy has the following advantages:

  1. Simple to operate. Trade signals are generated simply based on golden crosses of EMA lines, which is easy to understand and implement for automated quantitative trading.

  2. Strong reversal capture capability. As a trend following indicator, crosses of short-term and long-term EMAs often imply reversals between short-term and long-term trends, providing opportunities to capture reversals.

  3. Good smooth noise reduction effect. EMA itself has the feature of smoothing out noises, helping filter out short-term market noises and generate high quality trading signals.

  4. Optimized parameter design. The periods of the FAST EMA and SLOW EMA are optimized to balance capturing reversals and filtering out noises, resulting in solid signals.

  5. Scientific position sizing. Based on the ATR and risk-reward ratio, position sizes are optimized for effective single trade risk control and robust money management.

Risk Analysis

The Optimized EMA Golden Cross Strategy also contains some risks, mainly in:

  1. Not suitable for trending markets. EMA crosses tend to underperform in strongly trending markets, potentially generating excessive invalid signals.

  2. Sensitive to parameters. The choices of FAST EMA and SLOW EMA periods significantly impact strategy performance, requiring careful testing and optimization.

  3. Signal lag. EMA cross signals inherently have some lag, which may result in missing best entry points.

  4. No stop loss. The current code does not include stop loss mechanisms, leading to large drawdown risks.

The solutions are:

  1. Adopt multi-factor models with other indicators judging trends.

  2. Fully backtest to find optimal parameter sets.

  3. Combine with leading indicators like MACD zero line crosses.

  4. Develop reasonable stop loss strategies, e.g. ATR trailing stops or close-by stops.

Optimization Directions

The optimization directions of the Optimized EMA Golden Cross Strategy mainly focus on:

  1. Enhancing multi-market adaptiveness. Introduce market regime judgments to disable strategy in trending markets, reducing invalid signals.

  2. Parameter optimization. Find optimum sets via genetic algorithms to improve stability.

  3. Introducing stop loss mechanisms. Apply proper stop loss rules like ATR trailing stops, moving stops or close-by stops.

  4. Optimizing backtesting periods. Analyze data of different timeframes to find optimal execution cycles.

  5. Improving position sizing. Refine position sizing algorithms to find the optimum balance between risk and return.

These measures will help reduce unnecessary signals, control drawdowns, and enhance the stability and profitability of the strategy.

Summary

The Optimized EMA Golden Cross Strategy is a simple yet effective quantitative strategy. It utilizes the excellent properties of EMA to generate trading signals, and optimizes further based on that. The strategy has advantages like easy operation, strong reversal capturing capability, parameter optimization and scientific position sizing; it also has some market adaptiveness risks and signal quality risks. The future optimization spaces lie in improving stability and multi-market adaptiveness. Through constant optimization practices, this strategy has the potential to become a reliable quantitative solution.


/*backtest
start: 2024-01-09 00:00:00
end: 2024-01-16 00:00:00
period: 45m
basePeriod: 5m
exchanges: [{"eid":"Futures_Binance","currency":"BTC_USDT"}]
*/

// This Pine Script™ code is subject to the terms of the Mozilla Public License 2.0 at https://mozilla.org/MPL/2.0/
// © mayurtale972
//@version=4
strategy("Optimized EMA Crossover Strategy - 15-Min", overlay=true, shorttitle="EMA15")

// Input parameters
fastLength = input(7, title="Fast EMA Length")
slowLength = input(20, title="Slow EMA Length")
riskRewardRatio = input(2.5, title="Risk-Reward Ratio")

// Calculate EMAs
fastEMA = ema(close, fastLength)
slowEMA = ema(close, slowLength)

// Plot EMAs on the chart
plot(fastEMA, color=color.blue, title="Fast EMA")
plot(slowEMA, color=color.red, title="Slow EMA")

// Entry conditions
longCondition = crossover(fastEMA, slowEMA)
shortCondition = crossunder(fastEMA, slowEMA)

// Exit conditions
closeLongCondition = crossunder(fastEMA, slowEMA)
closeShortCondition = crossover(fastEMA, slowEMA)

// Calculate position size based on risk-reward ratio
riskAmount = 1.5
positionSize = strategy.equity * riskAmount / (riskRewardRatio * atr(14))

// Execute trades with calculated position size
strategy.entry("Long", strategy.long, when=longCondition)
strategy.entry("Short", strategy.short, when=shortCondition)

// Exit trades based on conditions
strategy.close("Long", when=closeLongCondition)
strategy.close("Short", when=closeShortCondition)

// Plot entry and exit points on the chart
plotshape(series=longCondition, title="Buy Signal", color=color.green, style=shape.labelup, text="Buy")
plotshape(series=shortCondition, title="Sell Signal", color=color.red, style=shape.labeldown, text="Sell")
plotshape(series=closeLongCondition, title="Close Buy Signal", color=color.red, style=shape.labeldown, text="Close Buy")
plotshape(series=closeShortCondition, title="Close Sell Signal", color=color.green, style=shape.labelup, text="Close Sell")

template: strategy.tpl:40:21: executing "strategy.tpl" at <.api.GetStrategyListByName>: wrong number of args for GetStrategyListByName: want 7 got 6