概述
“基于EMA和SMA交叉的趋势跟踪策略”是一个基于指数移动平均线(EMA)和简单移动平均线(SMA)交叉的趋势跟踪交易策略。该策略旨在通过捕捉短期EMA跨过长期SMA的时机,识别潜在的买入和卖出信号。
策略原理
该策略基于两个条件判断产生交易信号:
- 最新5期EMA上穿最新20期SMA
- 4小时级别上,最新5期EMA上穿最新20期SMA
当这两个条件同时满足时,产生买入信号;当这两个条件同时不满足时,产生卖出信号。
该策略通过比较不同时间周期上的EMA和SMA的交叉情况,综合判断趋势方向,产生交易信号。短期EMA反映价格的趋势变化更为敏感,而长期SMA具有更好的趋势过滤能力。当短期EMA上穿长期SMA时,表示价格略微反转,进入趋势状况,因此产生买入信号;反之,短期EMA下穿长期SMA时,表示趋势结束,因此产生卖出信号。
同时,策略加入4小时级别EMA和SMA的判断,可过滤掉短期噪音,使交易信号更加可靠。
策略优势
该策略具有以下优势:
- 简单实用,容易理解实现
- 响应迅速,可及时捕捉趋势转折
- 结合多时间周期判断,可有效过滤噪音
策略风险
该策略也存在一些风险:
- 容易产生假信号,须慎重验证信号
- 无法很好应对趋势震荡市
- 需谨慎选择EMA和SMA的参数
可通过加入止损止盈、优化参数等方法来控制风险。
优化方向
该策略可从以下几个方面进行优化:
- 测试更多的EMA和SMA周期参数组合
- 加入其它指标进行信号验证,如MACD、布林带等
- 建立动态止损机制
- 结合交易量进行信号过滤
总结
该策略整体较为简单实用,通过EMA和SMA交叉判断趋势转折,是一个基础的趋势跟踪策略。可通过参数优化、信号过滤等方法进行改进,从而适应更多市场情况,提高策略效果。
策略源码
/*backtest
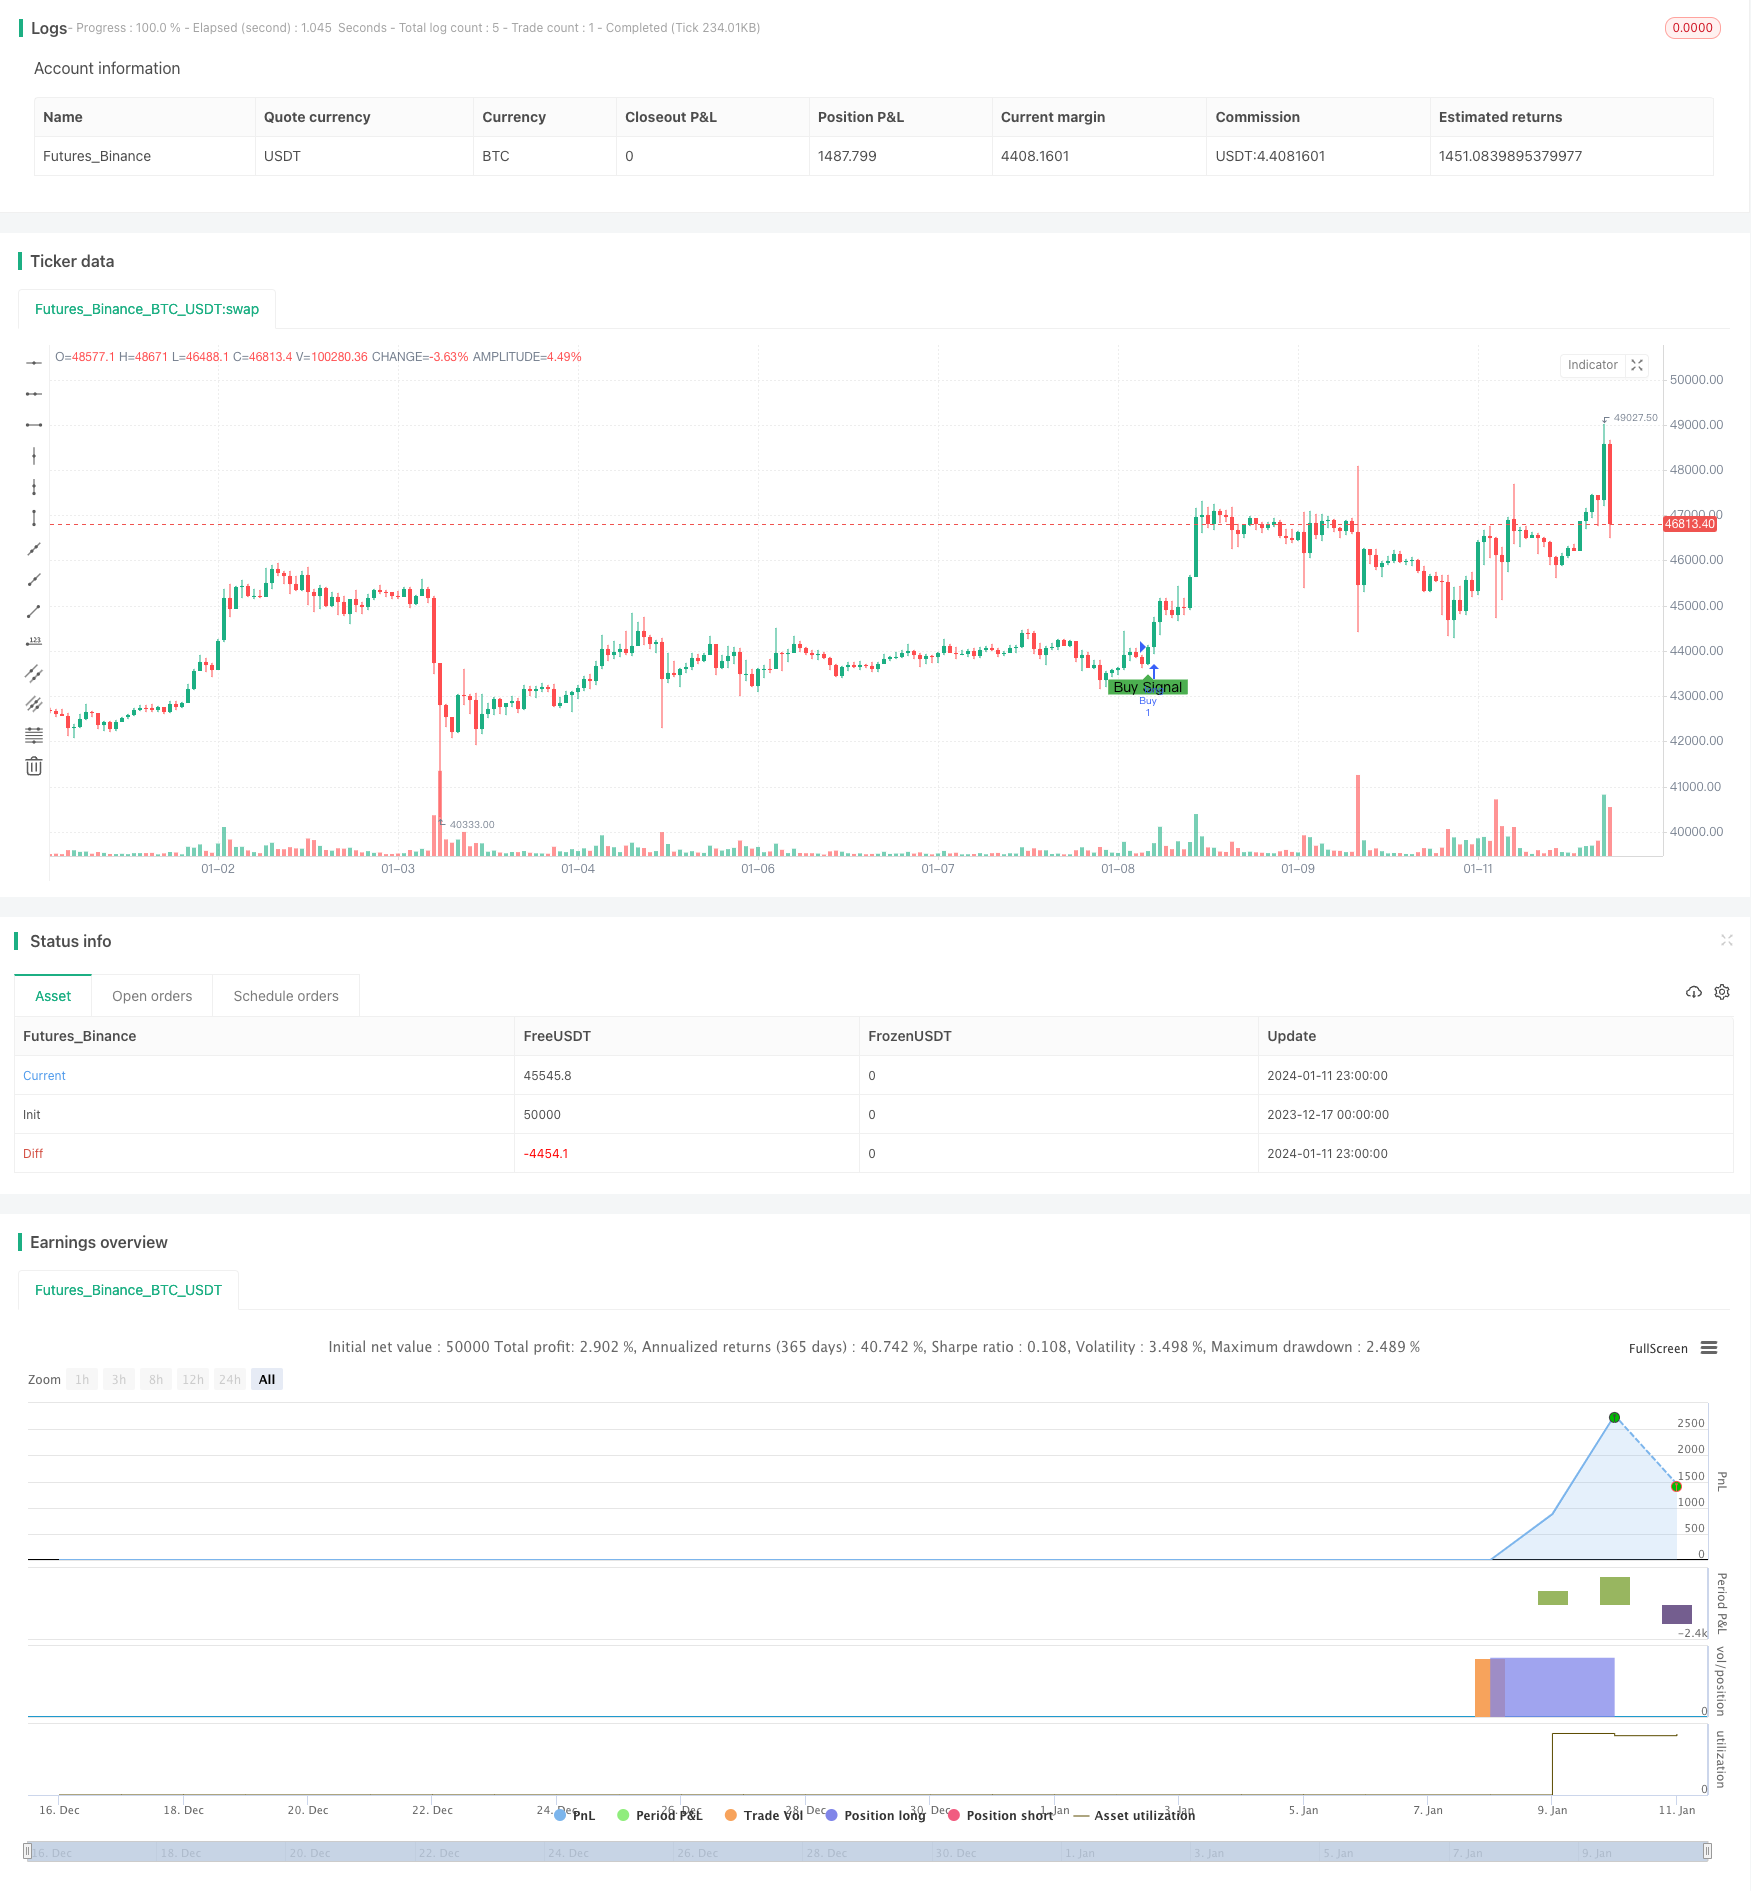
start: 2023-12-17 00:00:00
end: 2024-01-12 00:00:00
period: 1h
basePeriod: 15m
exchanges: [{"eid":"Futures_Binance","currency":"BTC_USDT"}]
*/
//@version=5
strategy("EMA and SMA Crossover Strategy", shorttitle="Shashank Cross", overlay=true)
// Condition 1: Latest EMA (Close, 5) crossed above Latest SMA (Close, 20)
ema5 = ta.ema(close, 5)
sma20 = ta.sma(close, 20)
condition1 = ta.crossover(ema5, sma20)
// Condition 2: [0] 4-hour EMA ([0] 4-hour Close, 5) crossed above [0] 4-hour SMA ([0] 4-hour Close, 20)
ema5_4h = request.security(syminfo.tickerid, "240", ta.ema(close, 5))
sma20_4h = request.security(syminfo.tickerid, "240", ta.sma(close, 20))
condition2 = ta.crossover(ema5_4h, sma20_4h)
// Combine both conditions for a buy signal
buy_signal = condition1 and condition2
// Plotting signals on the chart
plotshape(buy_signal, color=color.green, style=shape.labelup, location=location.belowbar, size=size.small, text="Buy Signal")
// Strategy logic
if (buy_signal)
strategy.entry("Buy", strategy.long)
// Exit long position on the next bar at market price
if (ta.barssince(buy_signal) == 1)
strategy.close("Exit")
// You can add more code for stop-loss, take-profit, etc., as per your strategy.