概述
该策略通过计算均值PB指标和布林带上下轨,判断PB指标与布林带上下轨之间的金叉死叉关系,产生买入和卖出信号。当PB指标向上突破布林带中轨或下轨时,产生买入信号;当PB指标向下跌破布林带中轨或上轨时,产生卖出信号。
策略原理
策略的核心指标是均值PB指标。均值PB指标结合了均线系统的稳定性和PB指标的灵敏度,它使用一快一慢两个不同周期均线的差值来表达价格变化趋势,从而判断查看多空态势。
该策略还同时使用了布林带指标判断股价的超买超卖情况。布林带指标由中轨、上轨和下轨三条曲线组成。中轨线就是n天的移动平均线;上下轨则通过中轨及历史波动率计算得出。当股价接近上轨时为超买区,接近下轨时超卖区,而中轨附近为股票合理价格区间。
综上,该策略巧妙利用均值PB指标判定股价涨跌趋势,并辅以布林带指标判断超买超卖情况,在两者结合的指标关系中寻找买卖点,属于典型的数值指标交易策略。
优势分析
该策略主要优势有:
- 利用均值PB指标判断股价趋势变化,灵敏度高
- 辅以布林带指标识别超买超卖区位,提高确定买卖点的准确性
- 策略操作简单,容易实施
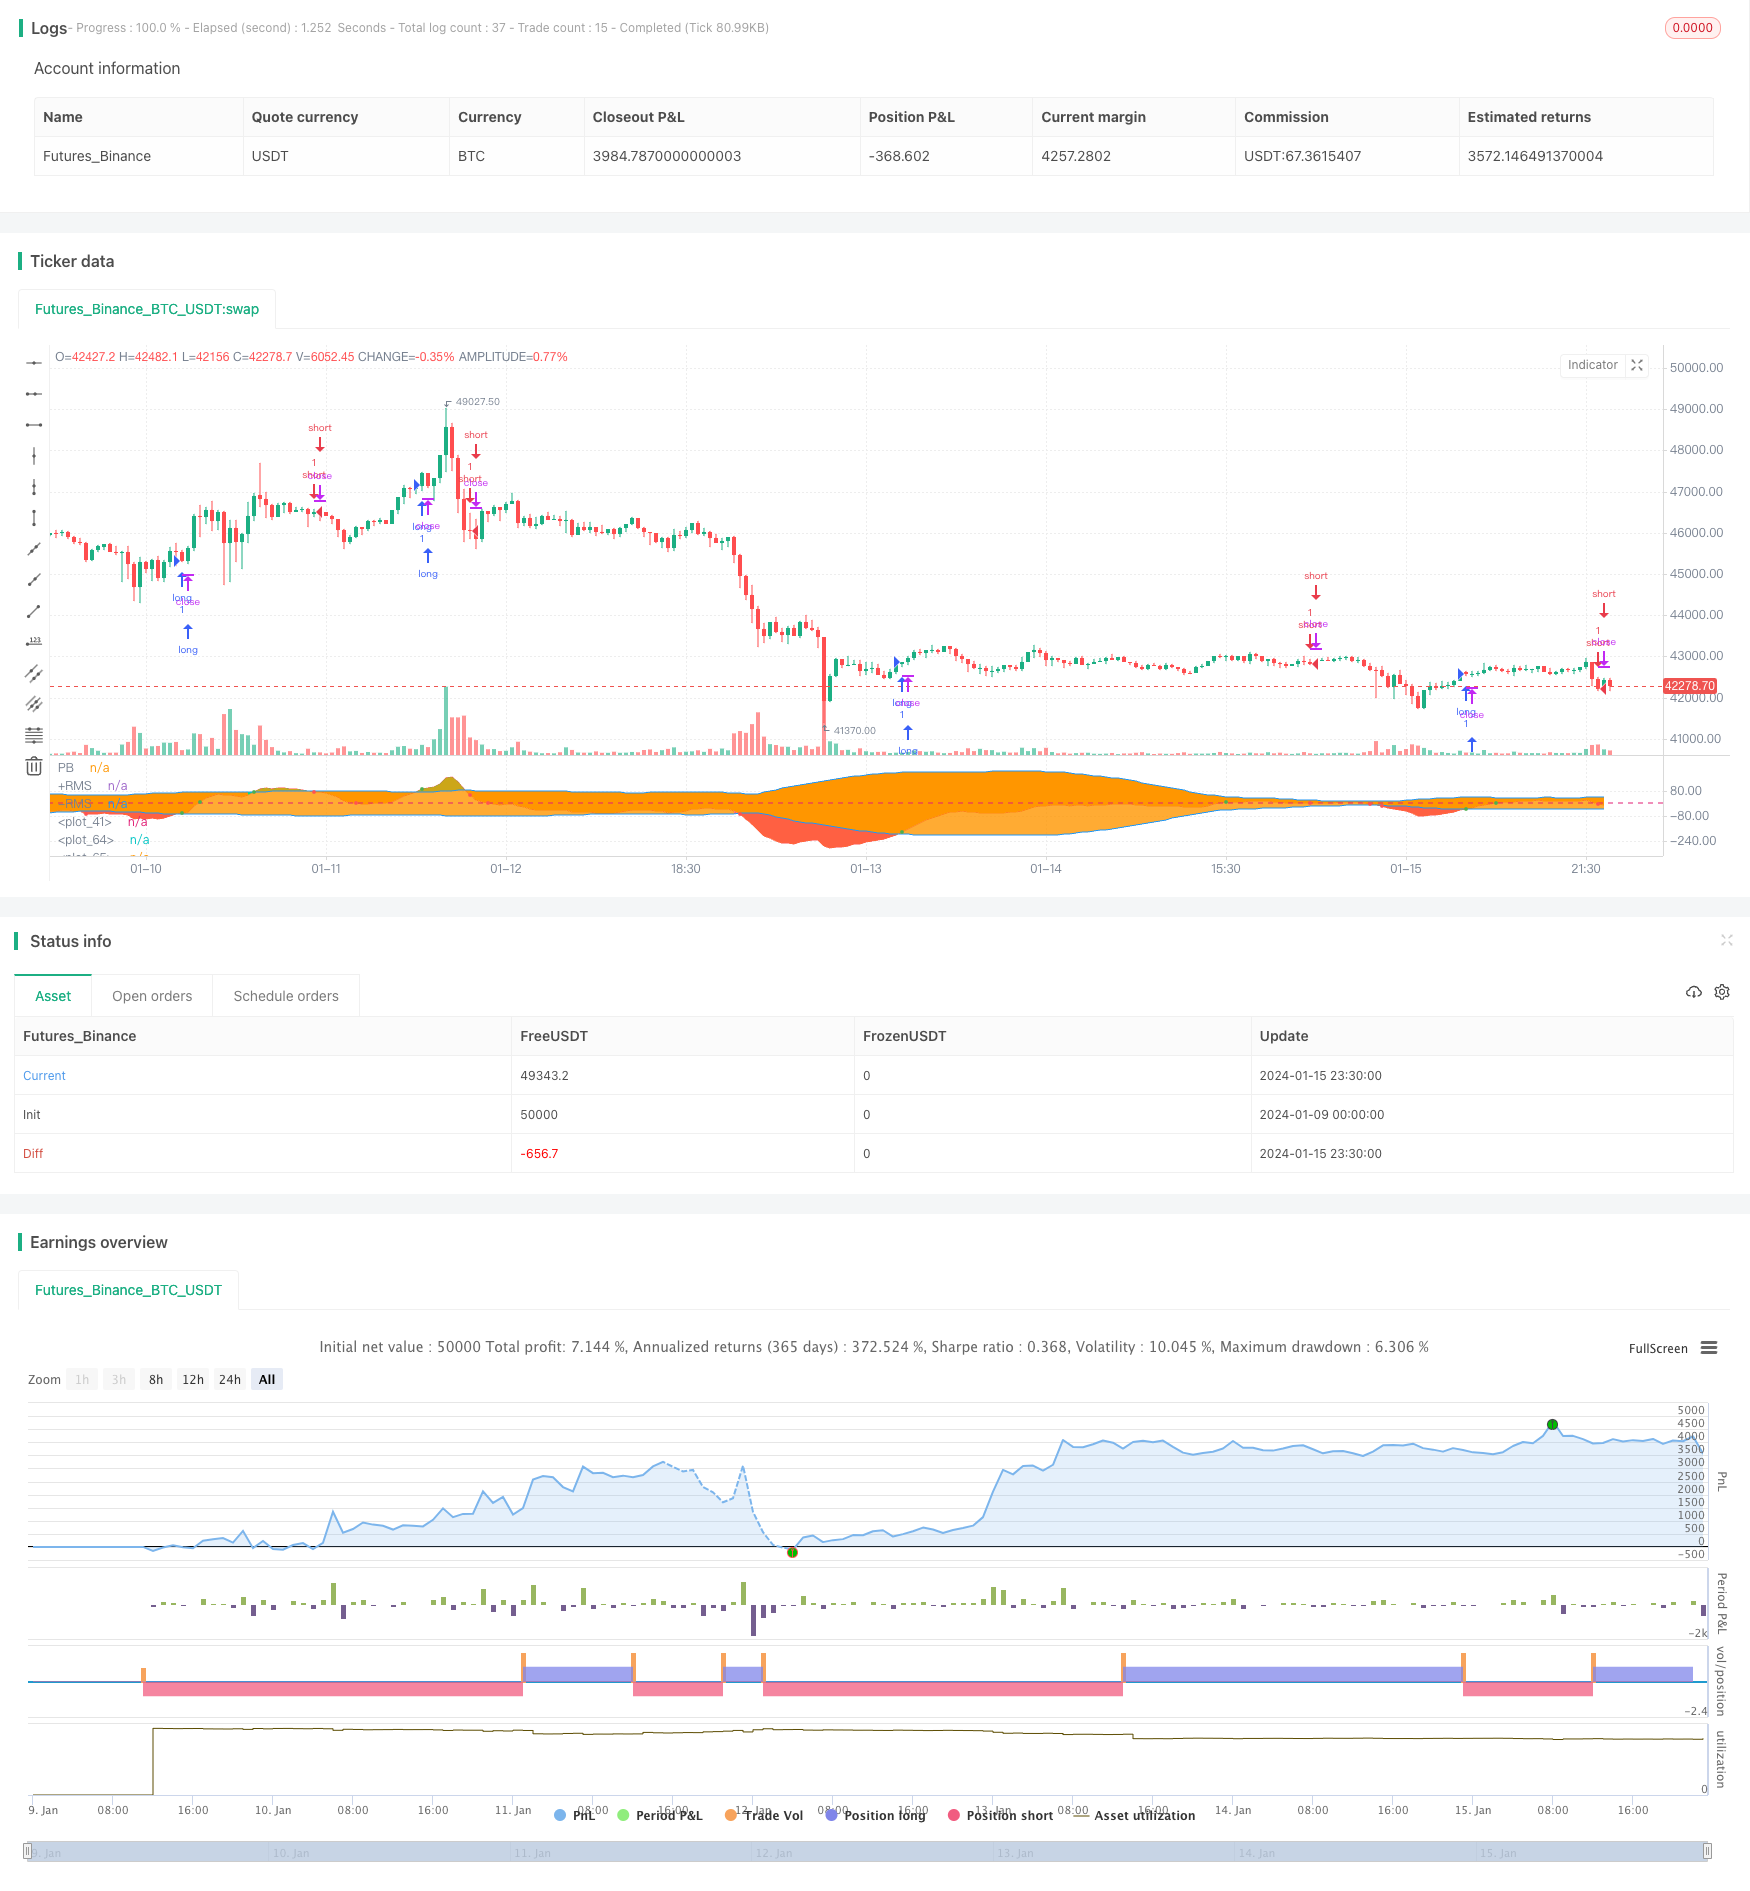
- 回测数据表明,策略收益较为可观
风险分析
该策略主要风险有:
- 均值PB指标和布林带指标都依赖历史数据计算,当股价出现大幅波动时,容易产生错误信号
- PB指标和布林带都对参数设置较为敏感,不当设置可能导致过多错误交易
- 策略实施期内,宏观环境变化可能对股价产生较大影响,如经济危机、政策变化等,可能导致策略失效
针对上述风险,可通过优化参数设置、严格止损、考量大环境因素、人工监控等方式进行风险规避。
优化方向
该策略可优化的方向包括:
- 优化均值PB指标和布林带的参数,找到最佳参数组合
- 增加其他指标过滤,如MACD、KDJ等,提高策略效果
- 增加止损机制,有效控制单笔损失
- 结合更大时间周期指标,判断大方向,避免逆势交易
总结
该策略整体运行效果较好,以均值PB指标为核心,辅以布林带判定买卖点,操作简单,灵敏度高,回测表现不俗。通过持续优化参数设置、增加其他指标辅助、严格止损等措施,能够进一步提高策略收益率和稳定性,值得实盘验证与应用。
策略源码
/*backtest
start: 2024-01-09 00:00:00
end: 2024-01-16 00:00:00
period: 30m
basePeriod: 15m
exchanges: [{"eid":"Futures_Binance","currency":"BTC_USDT"}]
*/

//@version=4
strategy("BandPass EOS", overlay=false, initial_capital = 1000)

src = input(close, "Source", input.source)
Period1 = input(41, "Fast Period", input.integer)
Period2 = input(54, "Slow Period", input.integer)
showBG = input(false, "Show crosses on background?", input.bool)
UseReversalStop = input(true, "Use additional triggers?", input.bool)

//Super Passband Filter
a1 = 0.0
a2 = 0.0
PB = 0.0
RMS = 0.0
if bar_index > Period1
    a1 := 5 / Period1
    a2 := 5 / Period2
    PB := (a1 - a2) * src + (a2 * (1 - a1) - a1 * (1 - a2)) * src[1] +
       (1 - a1 + 1 - a2) * nz(PB[1]) - (1 - a1) * (1 - a2) * nz(PB[2])
    for i = 0 to 49 by 1
        RMS := RMS + PB[i] * PB[i]
        RMS
    RMS := sqrt(RMS / 40)
    RMS
z = 0

buy = PB > PB [5] and crossover(PB, -RMS) or PB > PB [5] and crossover (PB, RMS) or PB > PB [5] and crossover (PB, z)
sell = PB < PB [5] and crossunder(PB, RMS) or PB < PB [5] and crossunder (PB, -RMS) or PB < PB [5] and crossunder (PB, z)
signal = buy ? 1 : sell ? -1 : 0
bg = buy ? color.green : sell ? color.red : color.white
bg := showBG ? bg : na
upperFill = PB>RMS ? color.lime : na
lowerFill = PB<-RMS ? color.red : na

p1 = plot(PB,"PB",color.red)
p2 = plot(RMS,"+RMS",color.blue)
p3 = plot(-RMS,"-RMS",color.blue)
bgcolor(bg)
fill(p1,p2,upperFill)
fill(p1,p3,lowerFill)
hline(0)


//PERIOD
testStartYear = input(2018, "Backtest Start Year")
testStartMonth = input(1, "Backtest Start Month")
testStartDay = input(1, "Backtest Start Day")
testPeriodStart = timestamp(testStartYear,testStartMonth,testStartDay, 0, 0)

testStopYear = input(2019, "Backtest Stop Year")
testStopMonth = input(12, "Backtest Stop Month")
testStopDay = input(31, "Backtest Stop Day")
testPeriodStop = timestamp(testStopYear,testStopMonth,testStopDay, 0, 0)

testPeriod() => true

lcolor = PB > PB [5] and crossover(PB, -RMS) or PB > PB [5] and crossover (PB, RMS) or PB > PB [5] and crossover (PB, z)
scolor = PB < PB [5] and crossunder(PB, RMS) or PB < PB [5] and crossunder (PB, -RMS) or PB < PB [5] and crossunder (PB, z)

c1 = (PB < PB [5] and crossunder(PB, RMS) or PB < PB [5] and crossunder (PB, -RMS) or PB < PB [5] and crossunder (PB, z))
c2 = (PB > PB [5] and crossover(PB, -RMS) or PB > PB [5] and crossover (PB, RMS) or PB > PB [5] and crossover (PB, z))

plot (c1 ? PB : na, style = plot.style_circles, color = color.red, linewidth = 3)
plot (c2 ? PB : na, style = plot.style_circles, color = color.green, linewidth = 3)

if (PB > PB [5] and crossover(PB, -RMS) or PB > PB [5] and crossover (PB, RMS) or PB > PB [5] and crossover (PB, z))
    strategy.entry("long", strategy.long, when = testPeriod())


if (PB < PB [5] and crossunder(PB, RMS) or PB < PB [5] and crossunder (PB, -RMS) or PB < PB [5] and crossunder (PB, z))
    strategy.entry("short", strategy.short, when = testPeriod())