概述
该策略名称为“双指标渐进DCA策略”。它基于布林通道和相对强度指数(RSI)这两个指标构建交易信号,同时利用渐进加仓的方法进行风险管理。其主要思想是在牛市中捕捉趋势,利用指标构建多头信号;而在跌势中利用渐进DCA策略降低成本。
策略原理
该策略融合了布林通道和RSI两个指标。布林通道能清晰判断行情趋势,布林中轨上方为牛市,下方为熊市。RSI指标则判断超买超卖现象。策略构建了一个MIX指标,它将布林通道价差和RSI的K值进行加权平均。当MIX指标由下向上突破20时产生多头信号。
渐进DCA部分,首先在MIX指标突破20时打开首单。之后每次价格下跌一定幅度,就按一定金额追加仓位。直至达到最大持仓量或者止损止盈退出。这样可以在行情低点多次加仓,实现成本均价的下移。
策略优势
双指标结合清晰判断趋势,增加信号准确性。
渐进DCA策略可以在跌势中降低仓位成本,减少亏损风险。同时增大盈利空间。
设定了止损和止盈条件,可以及时止损控制风险,也确保部分利润。
加入开仓日期范围参数,可以针对特定时间周期进行测试和优化。
风险及解决方法
布林通道和RSI指标均可能出现失效的情况。可以测试不同参数组合寻找最佳点位。
渐进DCA可能在大跌行情中持续追加仓位导致亏损放大。可以设定最大加仓次数,并适当提高止损线完善风险控制。
无法防止突发事件的异常行情。可加入大盘指标判断系统性风险,避开异常时期。
策略优化方向
测试优化MIX指标的参数,以获得更精确的交易信号。
优化止损止盈的参数,实现盈亏比的最大化。
测试不同追加开仓的幅度和次数,寻找最佳组合。
可以考虑加入交易量控制模块,在特定交易量条件下打开或关闭策略。
总结
“双指标渐进DCA策略”综合运用了多个量化技术指标与方法。它构建了清晰的趋势判断指标,并利用渐进加仓降低成本。同时,严格的止损止盈与风险控制手段使其可以安全实用。通过进一步测试与优化,该策略可以成为具备独特优势的量化交易方案。它既考虑获取足够盈利,也注重风险的控制,值得实盘验证与应用。
/*backtest
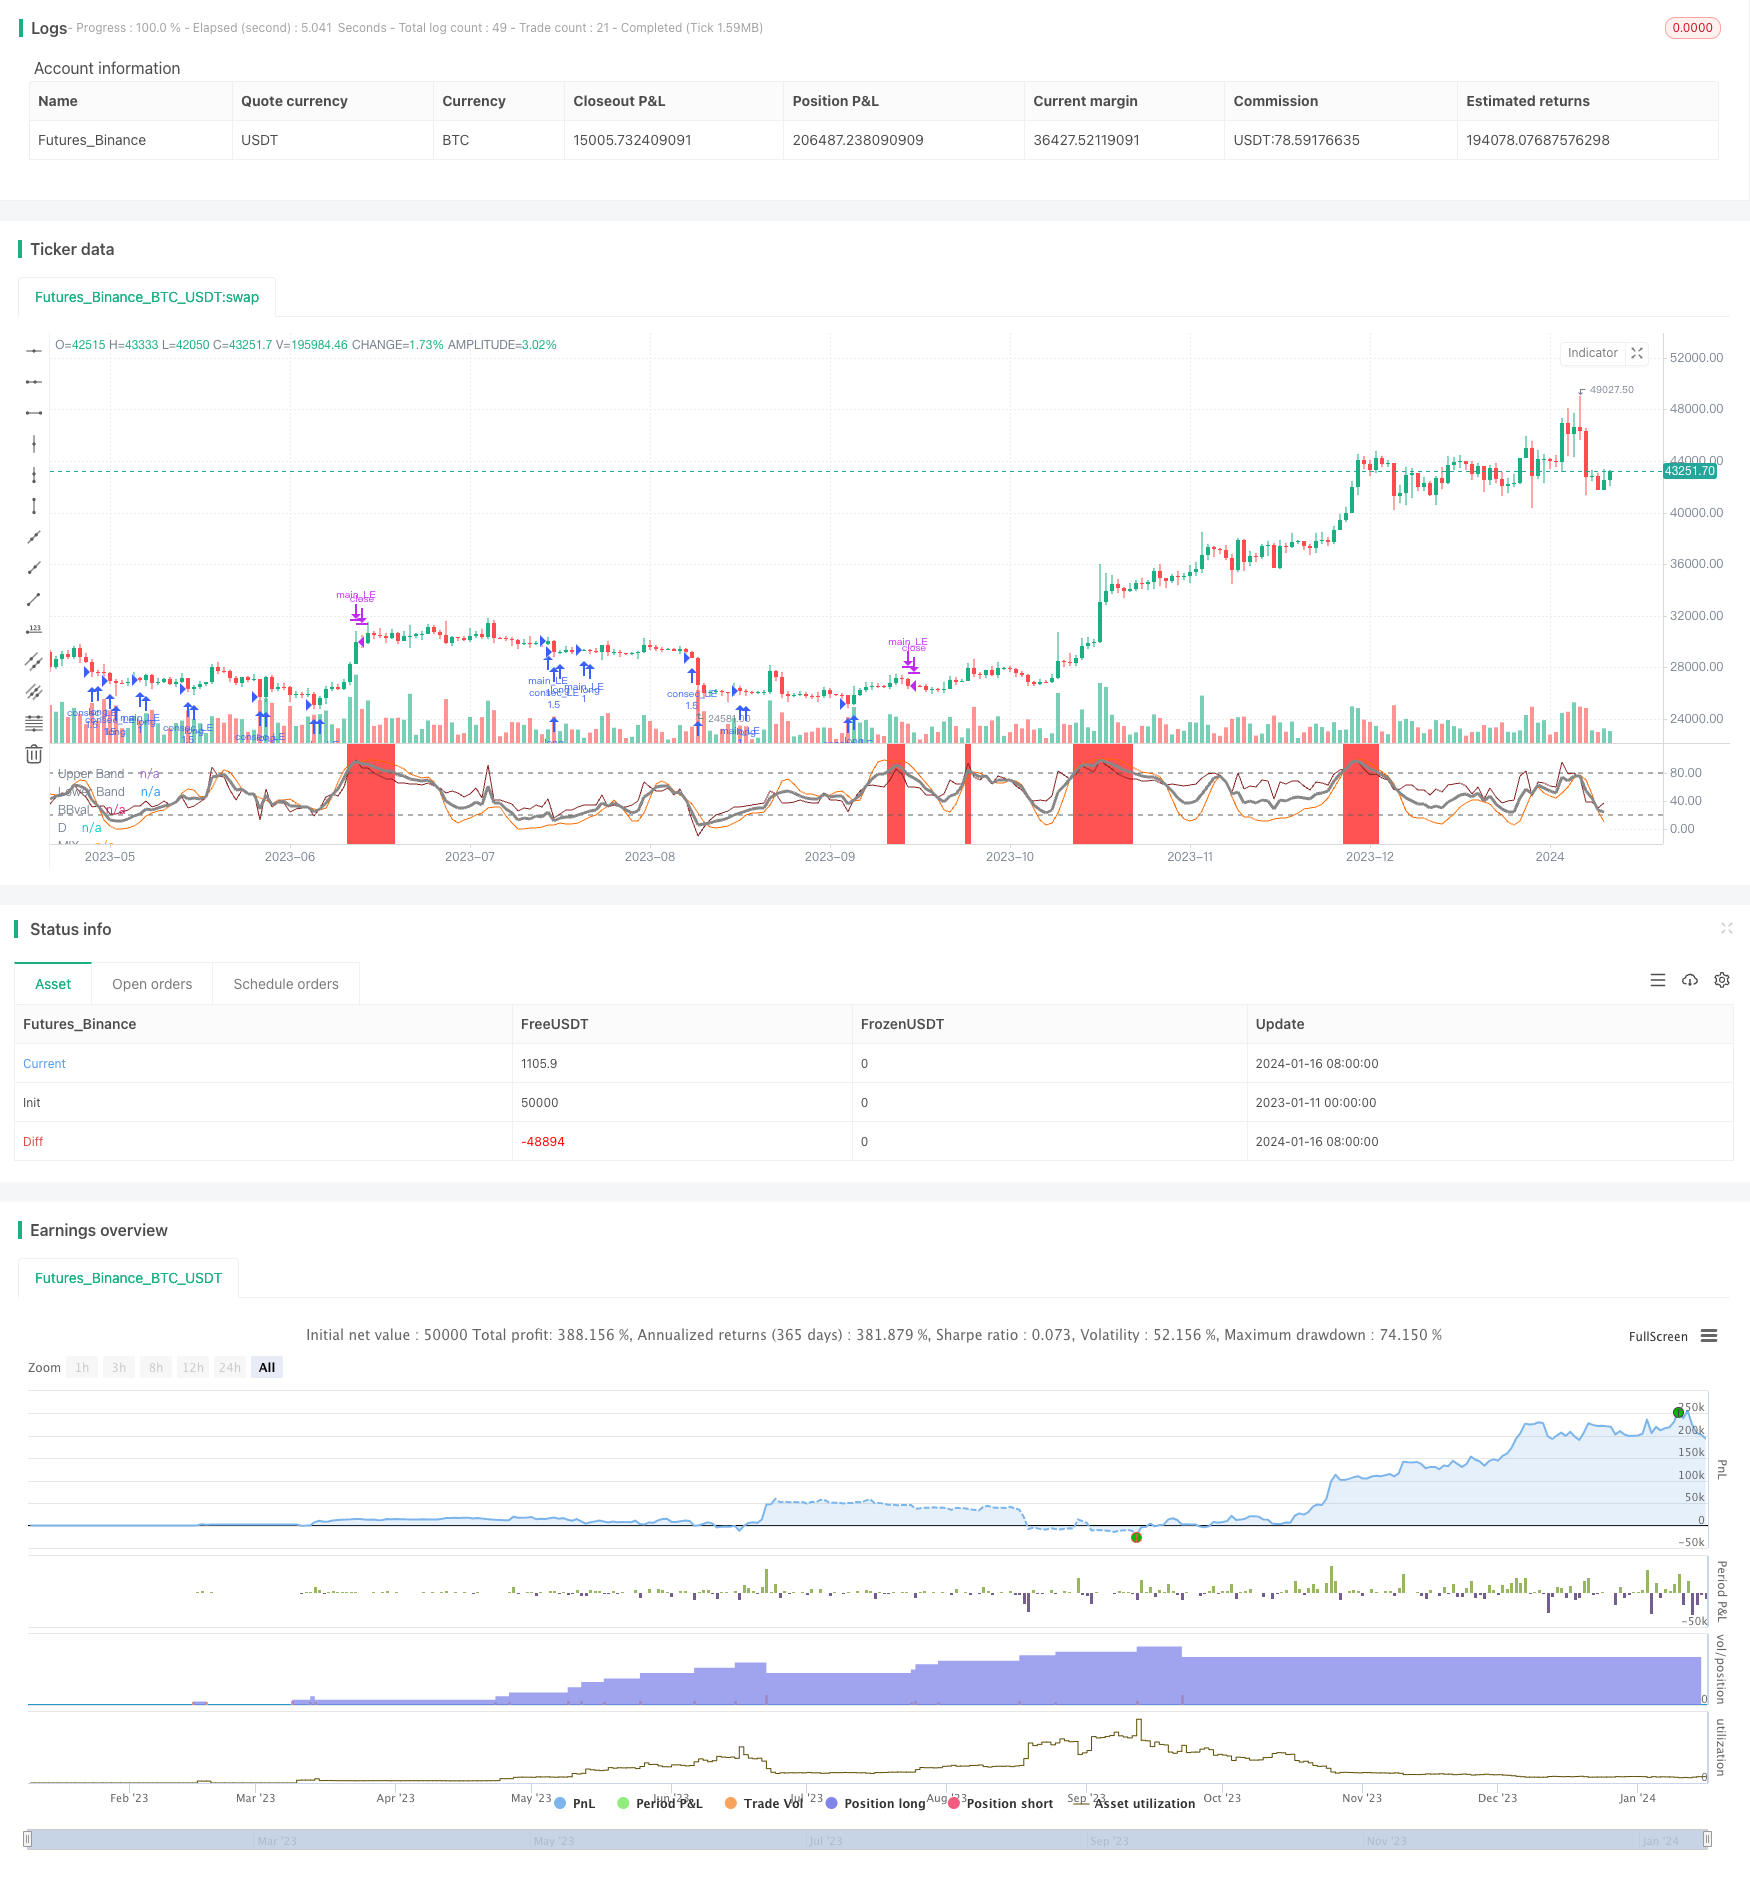
start: 2023-01-11 00:00:00
end: 2024-01-17 00:00:00
period: 1d
basePeriod: 1h
exchanges: [{"eid":"Futures_Binance","currency":"BTC_USDT"}]
*/
// © lagobrian23
//@version=4
strategy(title = 'Bollinger Bands and RSI mix with DCA', shorttitle = 'BB/RSI with DCA',pyramiding = 20, calc_on_every_tick = true, overlay = false )
source=close
smoothK = input(3, "K", minval=1)
smoothD = input(3, "D", minval=1)
lengthRSI = input(14, "RSI Length", minval=1)
lengthStoch = input(14, "Stochastic Length", minval=1)
src = input(close, title="RSI Source")
rsi1 = rsi(src, lengthRSI)
k = sma(stoch(rsi1, rsi1, rsi1, lengthStoch), smoothK)
d = sma(k, smoothD)
// Bollinger Band
length = input(20,title = 'BB lookback length', minval=1)
mult = input(2.0, minval=0.001, maxval=50, title="StdDev")
basis = sma(src, length)
dev = mult * stdev(src, length)
upper = basis + dev
lower = basis - dev
BBval = (src - basis)/dev*30+50
offset = input(0, title = "Offset", type = input.integer, minval = -500, maxval = 500)
mix=(d + BBval)/2
//plot
//plot(k, "K", color=#606060)
plot(BBval, "BBval", color=#872323, offset = offset)
plot(d, "D", color=#FF6A00)
h0 = hline(80, "Upper Band", color=#606060)
h1 = hline(20, "Lower Band", color=#606060)
plot(mix, "MIX", color=#888888, linewidth=3)
//background MIX
bgcolor(mix < 20 ? color.green : color.white, transp=50)
bgcolor(mix > 80 ? color.red : color.white, transp=50)
// Choosing the date range
fromMonth = input(defval = 1, title = "From Month", type = input.integer, minval = 1, maxval = 12)
fromDay = input(defval = 1, title = "From Day", type = input.integer, minval = 1, maxval = 31)
fromYear = input(defval = 2020, title = "From Year", type = input.integer, minval = 1970)
toMonth = input(defval = 1, title = "To Month", type = input.integer, minval = 1, maxval = 12)
toDay = input(defval = 1, title = "To Day", type = input.integer, minval = 1, maxval = 31)
toYear = input(defval = 2112, title = "To Year", type = input.integer, minval = 1970)
start = timestamp(fromYear, fromMonth, fromDay, 00, 00) // backtest start window
finish = timestamp(toYear, toMonth, toDay, 23, 59) // backtest finish window
window() => true
// Initializing the strategy paraeters
P = input(defval = 1, title = 'Amount (P)' , type = input.integer, minval = 1, maxval = 100)
X = input(defval = 2, title = '% Price drop for consecutive entries(X)', type = input.float, minval = 1, maxval = 100)
B_tp = input(defval = 10, title = '% Level for Take Profit (B)', type = input.float , minval = 1, maxval = 100)
D_sl = input(defval = 10, title = '% Level for Stop Loss (D)', type = input.float, minval = 1, maxval = 100)
A = input(defval = 5, title = 'Max consecutive entries (A)', type = input.integer, minval = 2, maxval = 20)
Z = input(defval = 0.5, title = 'Z', type = input.float , minval = 0, maxval = 10)
// Declaring key DCA variables
entry_price = 0.0
entry_price := na(entry_price[1]) ? na : entry_price[1]
new_entry = 0.0
consec_entryCondition = false
// Implementing the strategy
longEntry = crossover(mix,20)
exitLongs = crossunder(mix, 80)
if(longEntry)
entry_price := close
strategy.entry('main_LE', strategy.long , P, when = window() and longEntry)
// Exiting conditions
stoploss = strategy.position_avg_price*(1-(D_sl/100))
takeprofit = strategy.position_avg_price*(1+(B_tp/100))
slCondition = crossunder(close, stoploss)
tpCondition = crossover(close, takeprofit)
// We want to exit if the 'mix' indicator crosses 80, take profit is attained or stop loss is tagged.
exitConditions = exitLongs or slCondition or tpCondition
// Consecutive entries upto A times
// strategy.risk.max_intraday_filled_orders(A)
//Dollar-Cost-Averaging
// Enter long whenever price goes down X%: amount set to (P+Y)*Z
newAmount = (P+X)*Z
// If we haven't reached max open trades, buy newAmount immediately price crosses under X% lower the previous entry price
new_entry := entry_price - ((X/100)*entry_price)
consec_entryCondition := crossunder(close, new_entry)
if(consec_entryCondition and strategy.opentrades != A)
strategy.entry('consec_LE', strategy.long, newAmount, oca_name = 'consecLongs', when = window() and consec_entryCondition)
entry_price := close
// Exiting
// The main trade is closed only when the main exit conditions are satisfied
strategy.close('main_LE', comment = 'Main Long Closed', when = window() and exitConditions)
// A consective long is closed only when tp or sl is tagged
strategy.exit('ext a consec', 'consec_LE', loss = D_sl*strategy.position_avg_price , profit = B_tp*strategy.position_avg_price, oca_name = 'consecLongs')