Multi Timeframe Trend Tracking Strategy

Overview
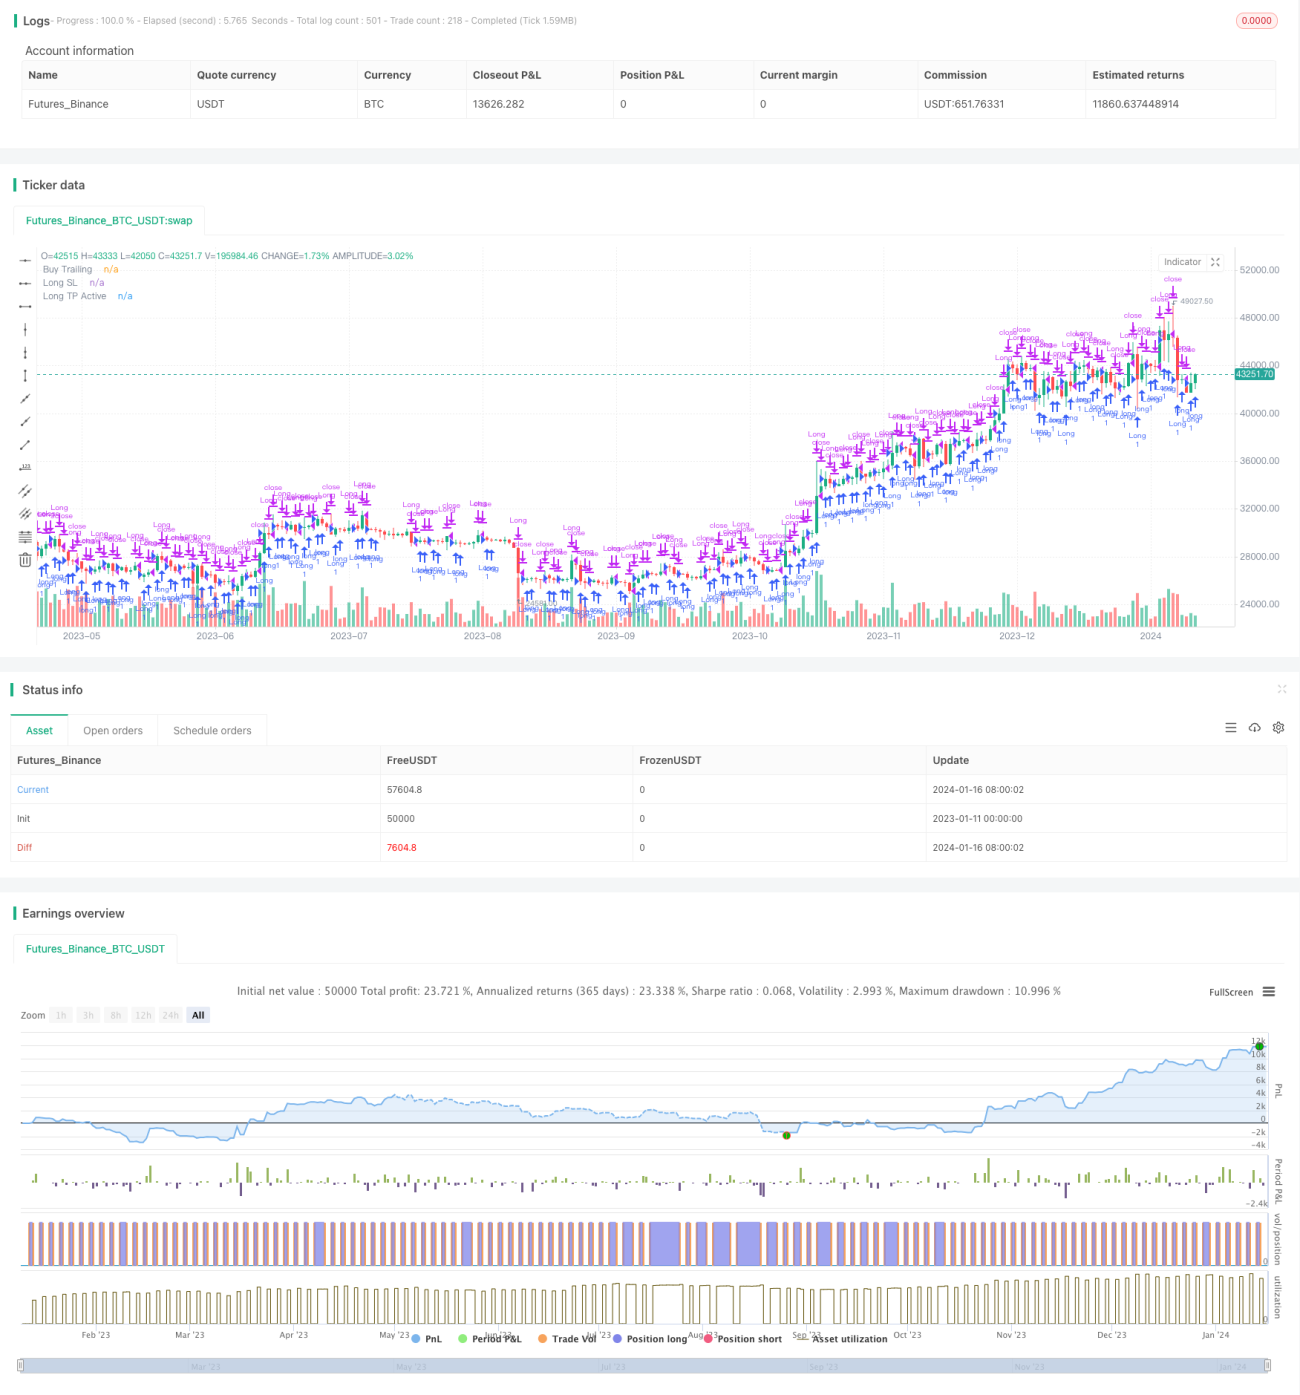
This strategy utilizes a combination of technical indicators across multiple timeframes to identify the trend direction for trend tracking. It combines RSI, Stoch, Stoch RSI, CCI and other indicators across the 1-min, 5-min, 15-min, 1-hour, 4-hour, and 1-day timeframes to look for combined signals meeting the criteria, thereby judging the overall current trend direction.
Strategy Logic
The core logic of this strategy lies in judging the combination of indicators across different timeframes. For each timeframe, the strategy checks whether indicators like RSI, Stoch, Stoch RSI, CCI etc. are within a set range and in an uptrend. If all the indicators in a timeframe meet the criteria, then that timeframe provides a “pass” signal.
Within the 1-min, 5-min, 15-min, 1-hour, 4-hour, and 1-day periods, any timeframe that passes provides a positive signal for tracking the overall trend. Only when all timeframes including the 1-min, 5-min, 15-min, 1-hour, 4-hour, and 1-day pass the “examination” will an actual buy signal be triggered.
In other words, if the trend judgments across all timeframes in a period are correct, then the overall trend judgment becomes very reliable, and that’s when a position will be opened for long. By judging the combined trend signals from indicators across multiple timeframes, the overall trend can be determined more precisely, filtering out false signals and reducing trading frequency.
Advantage Analysis
-
Using combined signals from indicators across multiple timeframes can significantly reduce false signals and lower trading frequency.
-
By observing trend consistency across multiple short-term and long-term timeframes, the overall trend direction can be determined more precisely.
-
Reasonable parameter settings can control drawdowns to some extent. Stop loss and take profit settings may lock in partial profits, lowering risks.
-
Allowing customizable combinations of indicator parameters enables tuning for different markets to improve adaptability.
Risk Analysis
-
Since this strategy tracks the overall trend, when trends reverse it may fail to exit positions in time, posing sizable drawdown risks.
-
Inadequate parameter settings may miss trend opportunities or increase trading frequency. Extensive backtests are needed to optimize parameters.
-
Judgments across multiple timeframes may miss short-term trend opportunities. Optimization can be helpful, by allowing signals even if criteria aren’t fully met on some timeframes.
Optimization Directions
-
Optimize parameters for technical indicators on each timeframe to find the optimum combination.
-
Test the effect of allowing signals based on judgments from only some timeframes. For instance, alignment of 1-min and 15-min may be sufficient for a buy.
-
Incorporate new technical indicators to enrich the types of indicators used for multi-timeframe judgments. MACD, KD, Bollinger Bands etc. can be considered.
-
Test stop loss and take profit levels to find optimum parameters. If stop loss range is too small, stop loss risks may increase; if too wide, profit opportunities may be missed.
Conclusion
The main innovation of this strategy lies in utilizing the combined signals from technical indicators across multiple timeframes to determine the overall trend direction. Ensuring short-term and long-term trend alignments before choosing entry timing can significantly reduce false signals and capture trend trading opportunities. Through parameter optimization, superb drawdown metrics can be obtained. Overall, this is a relatively stable, low-risk trend tracking strategy suitable for long-term holdings.
/*backtest
start: 2023-01-11 00:00:00
end: 2024-01-17 00:00:00
period: 1d
basePeriod: 1h
exchanges: [{"eid":"Futures_Binance","currency":"BTC_USDT"}]
*/

//@version=3
strategy("Intellitrader - Buy - BACKTESTER", overlay = true)
//study("APEX - Tester - Buy/Sell Strategies - Basic ", overlay = true)
source_main = close- 1