Bollinger Bands Breakout Strategy

Author: ChaoZhang, Date: 2024-01-18 12:18:34
Tags:

img

Overview

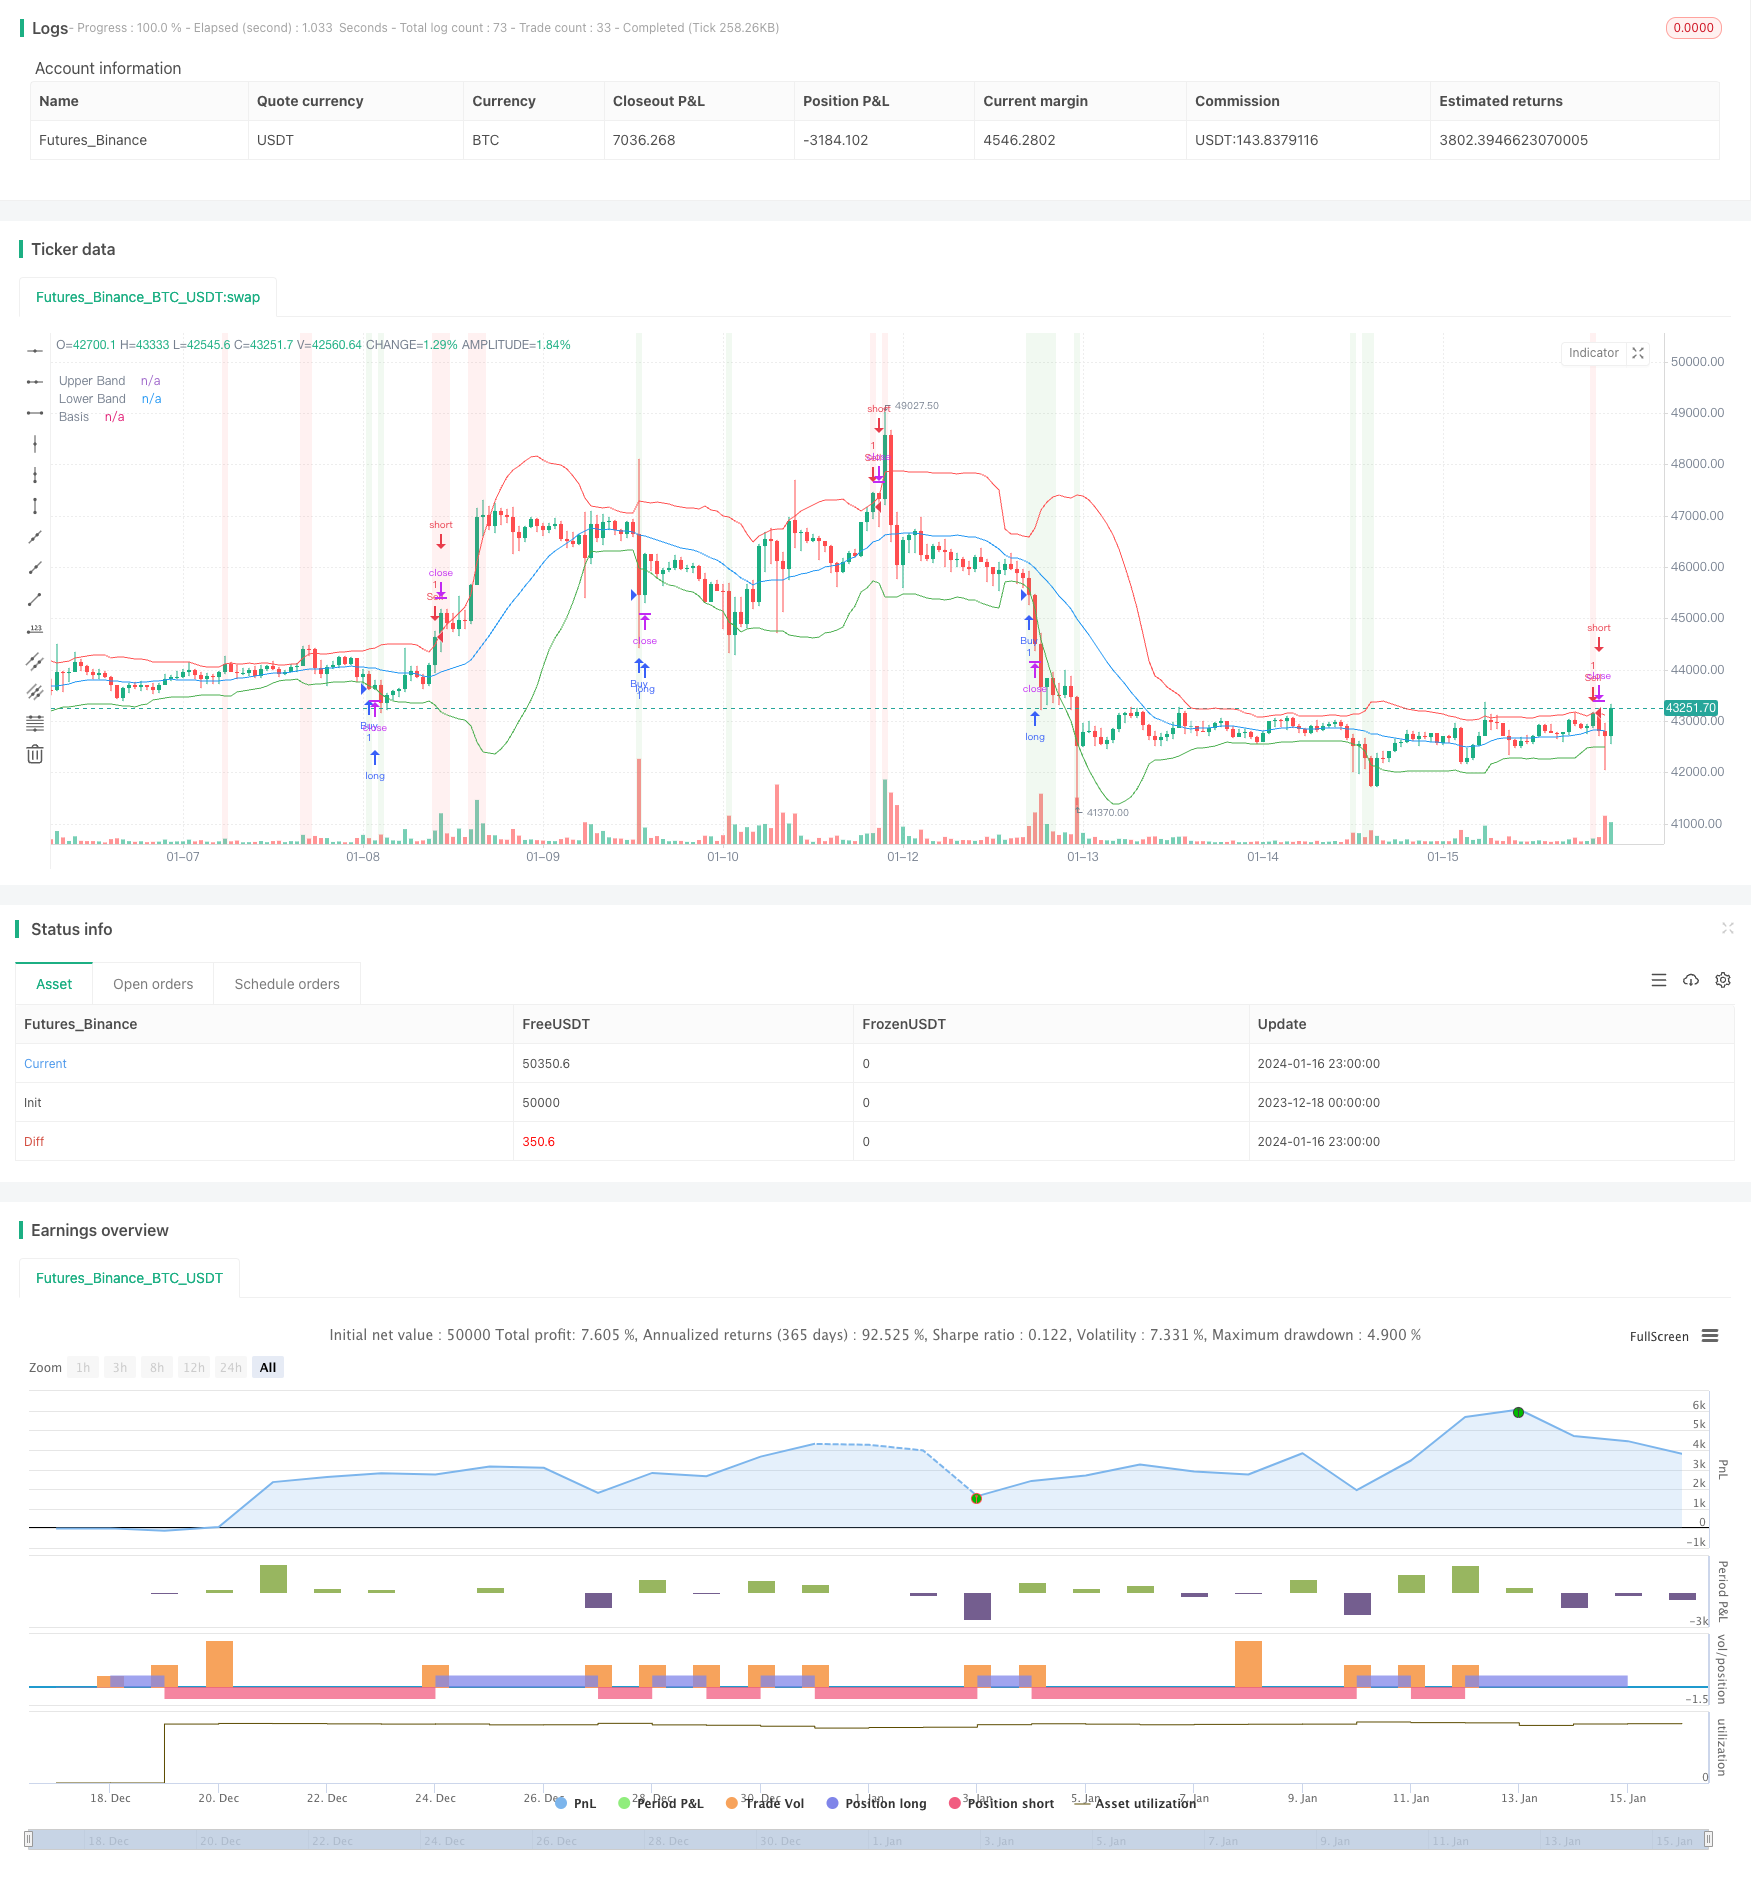
This strategy is a breakout strategy based on Bollinger Bands. It goes long when price breaks below the lower band and goes short when price breaks above the upper band. The strategy utilizes Bollinger Bands’ ability to clearly describe price fluctuation ranges to generate trading signals by capturing price breakouts.

Strategy Principle

The strategy first calculates a 20-day simple moving average as the middle benchmark line, then calculates the distance of two standard deviations above and below the benchmark line as the upper and lower rails of the Bollinger Bands. When the closing price is lower than the lower rail, it is considered oversold, generating a buy signal; when the closing price is higher than the upper rail, it is considered overbought, generating a sell signal.

Advantage Analysis

The strategy has the following advantages:

  1. Utilize Bollinger Bands’ feature of describing price fluctuation ranges, tends to generate trading signals during sizable fluctuations.

  2. Going long on lower rail breakouts can timely capture rebound opportunities.

  3. Going short on upper rail breakouts can timely capture downturn opportunities.

  4. The strategy idea is simple and clear, easy to understand and implement.

  5. Can be applied in various markets.

Risk Analysis

The strategy also has some risks:

  1. Prone to generating false signals when the market is calm.

  2. Unable to determine which direction the post-breakout price action will continue to develop towards.

  3. Unable to determine the momentum of reversal brought by the breakout signals.

  4. Inappropriate Bollinger Bands parameter settings can also affect the strategy’s performance.

  5. Need to appropriately control position sizing.

These risks can be controlled by optimizing parameters, strictly controlling positions, and setting stop losses.

Optimization Directions

The strategy can also be optimized in the following aspects:

  1. Optimize Bollinger Bands parameters to find the optimal parameter combination.

  2. Use other indicators for filtration to avoid false signals, such as momentum indicators, moving averages, etc.

  3. Set dynamic or trailing stop loss.

  4. Adjust long and short conditions according to market conditions.

  5. Conduct backtesting and paper trading to evaluate the strategy’s effectiveness.

Conclusion

Overall, this is a relatively classic and commonly used breakout strategy. It uses the Bollinger Bands indicator to describe price fluctuation ranges and captures its breakout signals to find trading opportunities. The strategy idea is simple and easy to implement, widely used in practice. Through continuous testing and optimization, its effectiveness can be improved and risks reduced. Therefore, the strategy is worth in-depth research and application.


/*backtest
start: 2023-12-18 00:00:00
end: 2024-01-17 00:00:00
period: 1h
basePeriod: 15m
exchanges: [{"eid":"Futures_Binance","currency":"BTC_USDT"}]
*/

//@version=5
strategy("Bollinger Bands Strategy", shorttitle="BB Strategy", overlay=true)

// Input parameters
length = input(20, title="Bollinger Bands Length")
mult = input(2, title="Multiplier")

// Calculate Bollinger Bands
basis = ta.sma(close, length)
bb_upper = basis + mult * ta.stdev(close, length)
bb_lower = basis - mult * ta.stdev(close, length)

// Buy and sell conditions
buy_condition = close < bb_lower
sell_condition = close > bb_upper

// Execute trades
strategy.entry("Buy", strategy.long, when=buy_condition)
strategy.entry("Sell", strategy.short, when=sell_condition)

// Plotting Bollinger Bands on the chart
plot(bb_upper, color=color.red, title="Upper Band")
plot(bb_lower, color=color.green, title="Lower Band")
plot(basis, color=color.blue, title="Basis")

// Highlighting buy and sell signals on the chart
bgcolor(buy_condition ? color.new(color.green, 90) : na)
bgcolor(sell_condition ? color.new(color.red, 90) : na)


More