概述
耐心追踪趋势策略是一种趋势跟随型策略。它利用移动平均线的指标组合判断趋势方向,并结合超买超卖指标CCI发出交易信号。该策略追求大趋势,在震荡行情中可以有效避免被套。
策略原理
该策略使用21周期和55周期的EMA组合判断趋势方向。当短期EMA在长期EMA上方时定义为上升趋势,当短期EMA在长期EMA下方时定义为下降趋势。
CCI指标用于判断超买超卖情况。CCI上穿-100线为底部超卖讯号,下穿100线为顶部超买讯号。根据CCI指标的不同超买超卖线,策略分为三个交易信号强度级别。
在判断为上升趋势时,如果CCI指标发出强烈的底部超卖信号,就进行多头入场。判断为下降趋势时,如果CCI指标发出强烈的顶部超买信号,就进行空头入场。
止损线设置为SuperTrend指标,目标利润设置为固定的点数。
优势分析
该策略主要有以下优势:
- 追踪大趋势,避免被套
- CCI指标可以有效判断反转点位
- SuperTrend止损线设置合理
- 固定止损与固定止盈,风险可控
风险分析
该策略主要存在以下风险:
- 大趋势判断失误的概率
- CCI指标发出假信号的概率
- 止损点过浅或过深造成不必要止损的概率
- 固定止盈无法持续追踪趋势获利的概率
针对这些风险,我们可以通过调整EMA周期参数,CCI参数以及止损止盈点位来优化。同时引入更多指标进行策略信号验证也很有必要。
优化方向
该策略的优化方向主要有:
1.测试更多指标的组合,寻找更优趋势判断以及信号验证指标。
2.利用ATR动态止损止盈,以更好地跟踪趋势和控制风险。
3.引入基于历史数据训练的机器学习模型来判断趋势概率。
4.针对不同品种参数进行调整优化。
总结
耐心追踪趋势策略整体是一个非常实用的趋势跟随策略。它利用移动平均线判断大趋势方向,CCI指标发现反转点位信号,超级趋势止损线设定合理。通过参数调整与多指标组合验证,该策略可以进一步优化,值得长期实盘跟踪验证。
策略源码
/*backtest
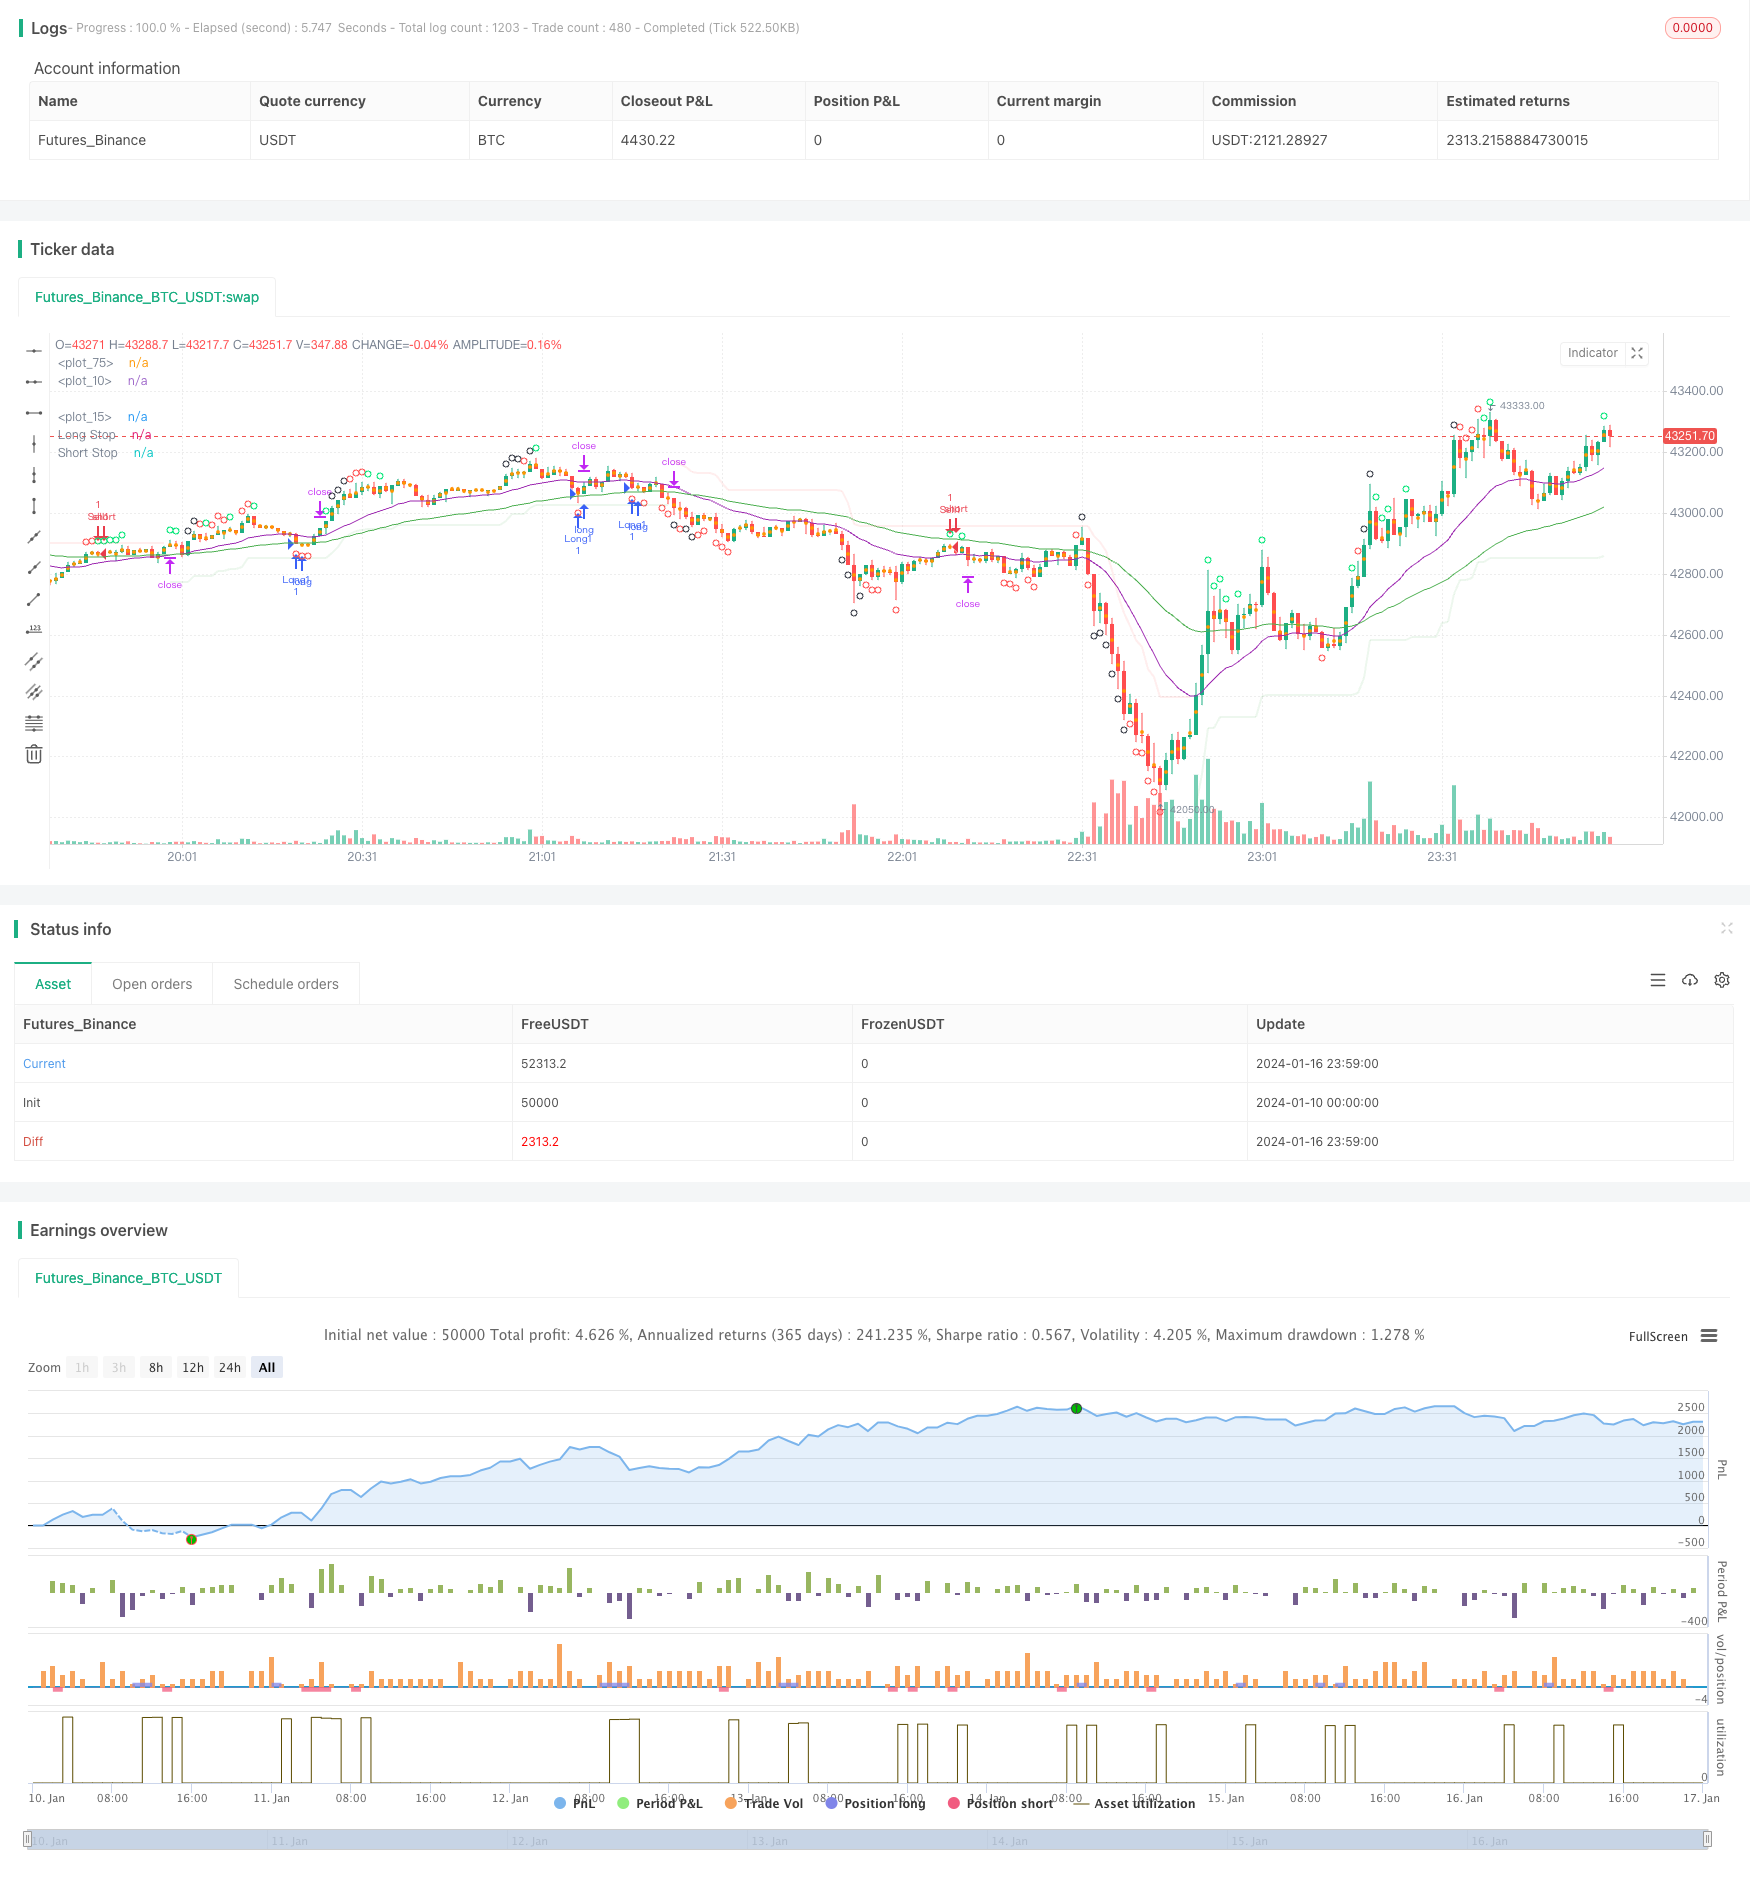
start: 2024-01-10 00:00:00
end: 2024-01-17 00:00:00
period: 1m
basePeriod: 1m
exchanges: [{"eid":"Futures_Binance","currency":"BTC_USDT"}]
*/
// This source code is subject to the terms of the Mozilla Public License 2.0 at https://mozilla.org/MPL/2.0/
// © greenmask9
//@version=4
strategy("Patient Trendfollower (7) Strategy", overlay=true)
// 21 EMA
emalength = input(21, title="Short EMA")
emashort = ema(close, emalength)
plot(emashort, color = color.purple, linewidth=1)
// 55 EMA
emalength2 = input(55, title="Long EMA")
ema = ema(close, emalength2)
plot(ema, color = color.green, linewidth=1)
//CCI calculation and inputs
lengthcci = input(20, minval=1, title="Overbought/sold detector period")
src = input(close, title="Overbought/sold detector source")
ma = sma(src, lengthcci)
ccivalue = (src - ma) / (0.015 * dev(src, lengthcci))
//CCI plotting
ccioverbought = input(defval=100, title="Overbought level 1")
ccioverbought2 = input(defval=140, title="Overbought level 2")
ccioverbought3 = input(defval=180, title="Overbought level 3")
ccioversold = input(defval=-100, title="Oversold level 1")
ccioversold2 = input(defval=-140, title="Oversold level 2")
ccioversold3 = input(defval=-180, title="Oversold level 3")
cciOB = (ccivalue >= ccioverbought and ccivalue < ccioverbought2)
plotshape(cciOB, title= "Overbought", location=location.abovebar, color=color.lime, transp=0, style=shape.circle)
cciOS = (ccivalue <= ccioversold and ccivalue > ccioversold2)
plotshape(cciOS, title= "Oversold", location=location.belowbar, color=color.lime, transp=0, style=shape.circle)
cciOB2 = (ccivalue >= ccioverbought2 and ccivalue < ccioverbought3)
plotshape(cciOB2, title= "Overbought", location=location.abovebar, color=color.red, transp=0, style=shape.circle)
cciOS2 = (ccivalue <= ccioversold and ccivalue > ccioversold3)
plotshape(cciOS2, title= "Oversold", location=location.belowbar, color=color.red, transp=0, style=shape.circle)
cciOB3 = (ccivalue >= ccioverbought3)
plotshape(cciOB3, title= "Overbought", location=location.abovebar, color=color.black, transp=0, style=shape.circle)
cciOS3 = (ccivalue <= ccioversold3)
plotshape(cciOS3, title= "Oversold", location=location.belowbar, color=color.black, transp=0, style=shape.circle)
//Supertrend
length = input(title="ATR Period", type=input.integer, defval=55)
mult = input(title="ATR Multiplier", type=input.float, step=0.1, defval=5.0)
wicks = input(title="Take Wicks into Account ?", type=input.bool, defval=true)
illuminate = input(title="Illuminate Trend", type=input.bool, defval=true)
atr = mult * atr(length)
longStop = hl2 - atr
longStopPrev = nz(longStop[1], longStop)
longStop := (wicks ? low[1] : close[1]) > longStopPrev ? max(longStop, longStopPrev) : longStop
shortStop = hl2 + atr
shortStopPrev = nz(shortStop[1], shortStop)
shortStop := (wicks ? high[1] : close[1]) < shortStopPrev ? min(shortStop, shortStopPrev) : shortStop
dir = 1
dir := nz(dir[1], dir)
dir := dir == -1 and (wicks ? high : close) > shortStopPrev ? 1 : dir == 1 and (wicks ? low : close) < longStopPrev ? -1 : dir
longColor = color.new(color.green, 90)
shortColor = color.new(color.red, 90)
noneColor = color.new(color.white, 100)
longStopPlot = plot(dir == 1 ? longStop : na, title="Long Stop", style=plot.style_linebr, linewidth=2, color=longColor)
shortStopPlot = plot(dir == 1 ? na : shortStop, title="Short Stop", style=plot.style_linebr, linewidth=2, color=shortColor)
midPricePlot = plot(ohlc4, title="", style=plot.style_circles, linewidth=0)
longFillColor = illuminate ? (dir == 1 ? longColor : noneColor) : noneColor
shortFillColor = illuminate ? (dir == -1 ? shortColor : noneColor) : noneColor
fill(midPricePlot, longStopPlot, title="Long State Filling", color=longFillColor)
fill(midPricePlot, shortStopPlot, title="Short State Filling", color=shortFillColor)
//entries
uptrend = emashort>ema and dir == 1
upsignal = ccivalue<=ccioversold and ccivalue>ccioversold2
upsignal2 = ccivalue<=ccioversold2 and ccivalue>ccioversold3
upsignal3 = ccivalue<=ccioversold3
downtrend = emashort<ema and dir == -1
downsignal = ccivalue>=ccioverbought and ccivalue<ccioverbought2
downsignal2 = ccivalue>=ccioverbought2 and ccivalue<ccioverbought3
downsignal3 = ccivalue>=ccioverbought3
//adapts to the current bar, I need to save the bars number when the condition for buy was true, static number is spread
spread = input (0.00020, title="Spread")
upstoploss = longStop - spread
downstoploss = shortStop + spread
strategy.initial_capital = 50000
ordersize=floor(strategy.initial_capital/close)
testlong = input(title="Test longs", type=input.bool, defval=true)
testshort = input(title="Test shorts", type=input.bool, defval=true)
//new
degree = input(title="Test level 1 overbought/sold levels", type=input.bool, defval=true)
degree2 = input(title="Test level 2 overbought/sold levels", type=input.bool, defval=false)
degree3 = input(title="Test level 3 overbought/sold levels", type=input.bool, defval=false)
statictarget = input(title="Use static target", type=input.bool, defval=true)
statictargetvalue = input(title="Static target in pips", type=input.integer, defval=400)
//timetrade = input(title="Open trades only withing specified time", type=input.bool, defval=true)
//timtrade = input()
//přidat možnost TP podle ATR a sl podle ATR
buy1 = uptrend and upsignal and strategy.opentrades==0 and testlong and degree
x1 = barssince (buy1)
if (buy1)
//bodlo by zakázat atrtarget v tomto případě
if (statictarget)
strategy.entry("Long1", strategy.long, ordersize)
strategy.exit( "Exitlong", from_entry="Long1" , profit=statictargetvalue,stop=upstoploss[x1])
buy2 = uptrend and upsignal2 and strategy.opentrades==0 and testlong and degree2
x2 = barssince (buy2)
if (buy2)
//bodlo by zakázat atrtarget v tomto případě
if (statictarget)
strategy.entry("Long2", strategy.long, ordersize)
strategy.exit( "Exitlong", from_entry="Long2" , profit=statictargetvalue,stop=upstoploss[x2])
buy3 = uptrend and upsignal3 and strategy.opentrades==0 and testlong and degree3
x3 = barssince (buy3)
if (buy3)
//bodlo by zakázat atrtarget v tomto případě
if (statictarget)
strategy.entry("Long3", strategy.long, ordersize)
strategy.exit( "Exitlong", from_entry="Long3" , profit=statictargetvalue,stop=upstoploss[x3])
sell1 = downtrend and downsignal and strategy.opentrades==0 and testshort and degree
y1 = barssince (sell1)
if (sell1)
if (statictarget)
strategy.entry("Sell1", strategy.short, ordersize)
strategy.exit( "Exitshort", from_entry="Sell1" , profit=statictargetvalue,stop=downstoploss[y1])
sell2 = downtrend and downsignal2 and strategy.opentrades==0 and testshort and degree2
y2 = barssince (sell2)
if (sell2)
if (statictarget)
strategy.entry("Sell2", strategy.short, ordersize)
strategy.exit( "Exitshort", from_entry="Sell2" , profit=statictargetvalue,stop=downstoploss[y2])
sell3 = downtrend and downsignal3 and strategy.opentrades==0 and testshort and degree3
y3 = barssince (sell3)
if (sell3)
if (statictarget)
strategy.entry("Sell3", strategy.short, ordersize)
strategy.exit( "Exitshort", from_entry="Sell3" , profit=statictargetvalue,stop=downstoploss[y3])