概述
该策略利用供需区域、指数移动平均线(EMA)和平均真实波动范围(ATR)指数型移动止损进行交易信号判断。用户可以调整EMA参数设置和买卖信号的可见性。策略标记更高更高(HH)、更低更低(LL)、更低更高(LH)和更高更低(HL)等供需区域。第三根K线确认信号后发出交易指令。该脚本适合用来回测。
策略原理
指标计算
EMA指数移动平均线: - EMA根据一定周期(默认200)的收盘价计算得到。 - EMA公式:(EMA=(Pricet \times \alpha)+(EMA{t-1}×(1−\alpha))),其中(\alpha=\frac{2}{length+1})。
ATR平均真实波动幅度:
- ATR是衡量市场波动程度的指标,根据价格的真实波动范围计算。
- 真实波动范围为以下三者之最大值:
- 当前最高价减去当前最低价
- 当前最高价减去上一收盘价的绝对值
- 当前最低价减去上一收盘价的绝对值
- ATR典型计算周期为14。
这些计算用于判断EMA趋势判断和基于市场波动设置ATR移动止损。该策略旨在根据收盘价、EMA和ATR值的关系来提供买卖信号。
供需区域判断
策略中使用了“HH”(更高更高)、“LL”(更低更低)、“HL”(更高更低)和“LH”(更低更高)等术语来识别不同的价格行为模式,常用于趋势分析:
更高更高(HH):当前价格最高点高于之前的最高点,表示潜在的向上动量。
更低更低(LL):当前价格最低点低于之前的最低点,表示潜在的向下动量。
更高更低(HL):当前价格最低点高于之前的最低点,表示潜在的向上趋势继续。
更低更高(LH):当前价格最高点低于之前的最高点,表示潜在的向下趋势继续。
这些模式与其他技术指标配合使用可以确定潜在趋势的反转或继续。该策略利用这些模式来识别进入或退出的时机。
入场与止损 exit
入场信号:第三根K线收盘价高于/低于前一日最高价/最低价时产生买入/卖出信号。
止损方式:以ATR值的一定倍数(默认2倍)作为后撤止损点。
策略优势
- 结合了趋势、反转和波动率等多种因素,综合判断市场,避免假突破。
- 利用供需区域判断关键支撑阻力。
- ATR止损系统动态跟踪市场波动。
- 可自定义EMA和ATR参数。
- 简单的入场规则容易实施。
风险及优化
- 误判风险,需适当优化EMA长度。
- ATR倍数设置过大有追涨杀跌风险。
- 可考虑结合其他因素过滤入场信号。
- 可尝试以趋势狙击为主,供需为辅的策略。
总结
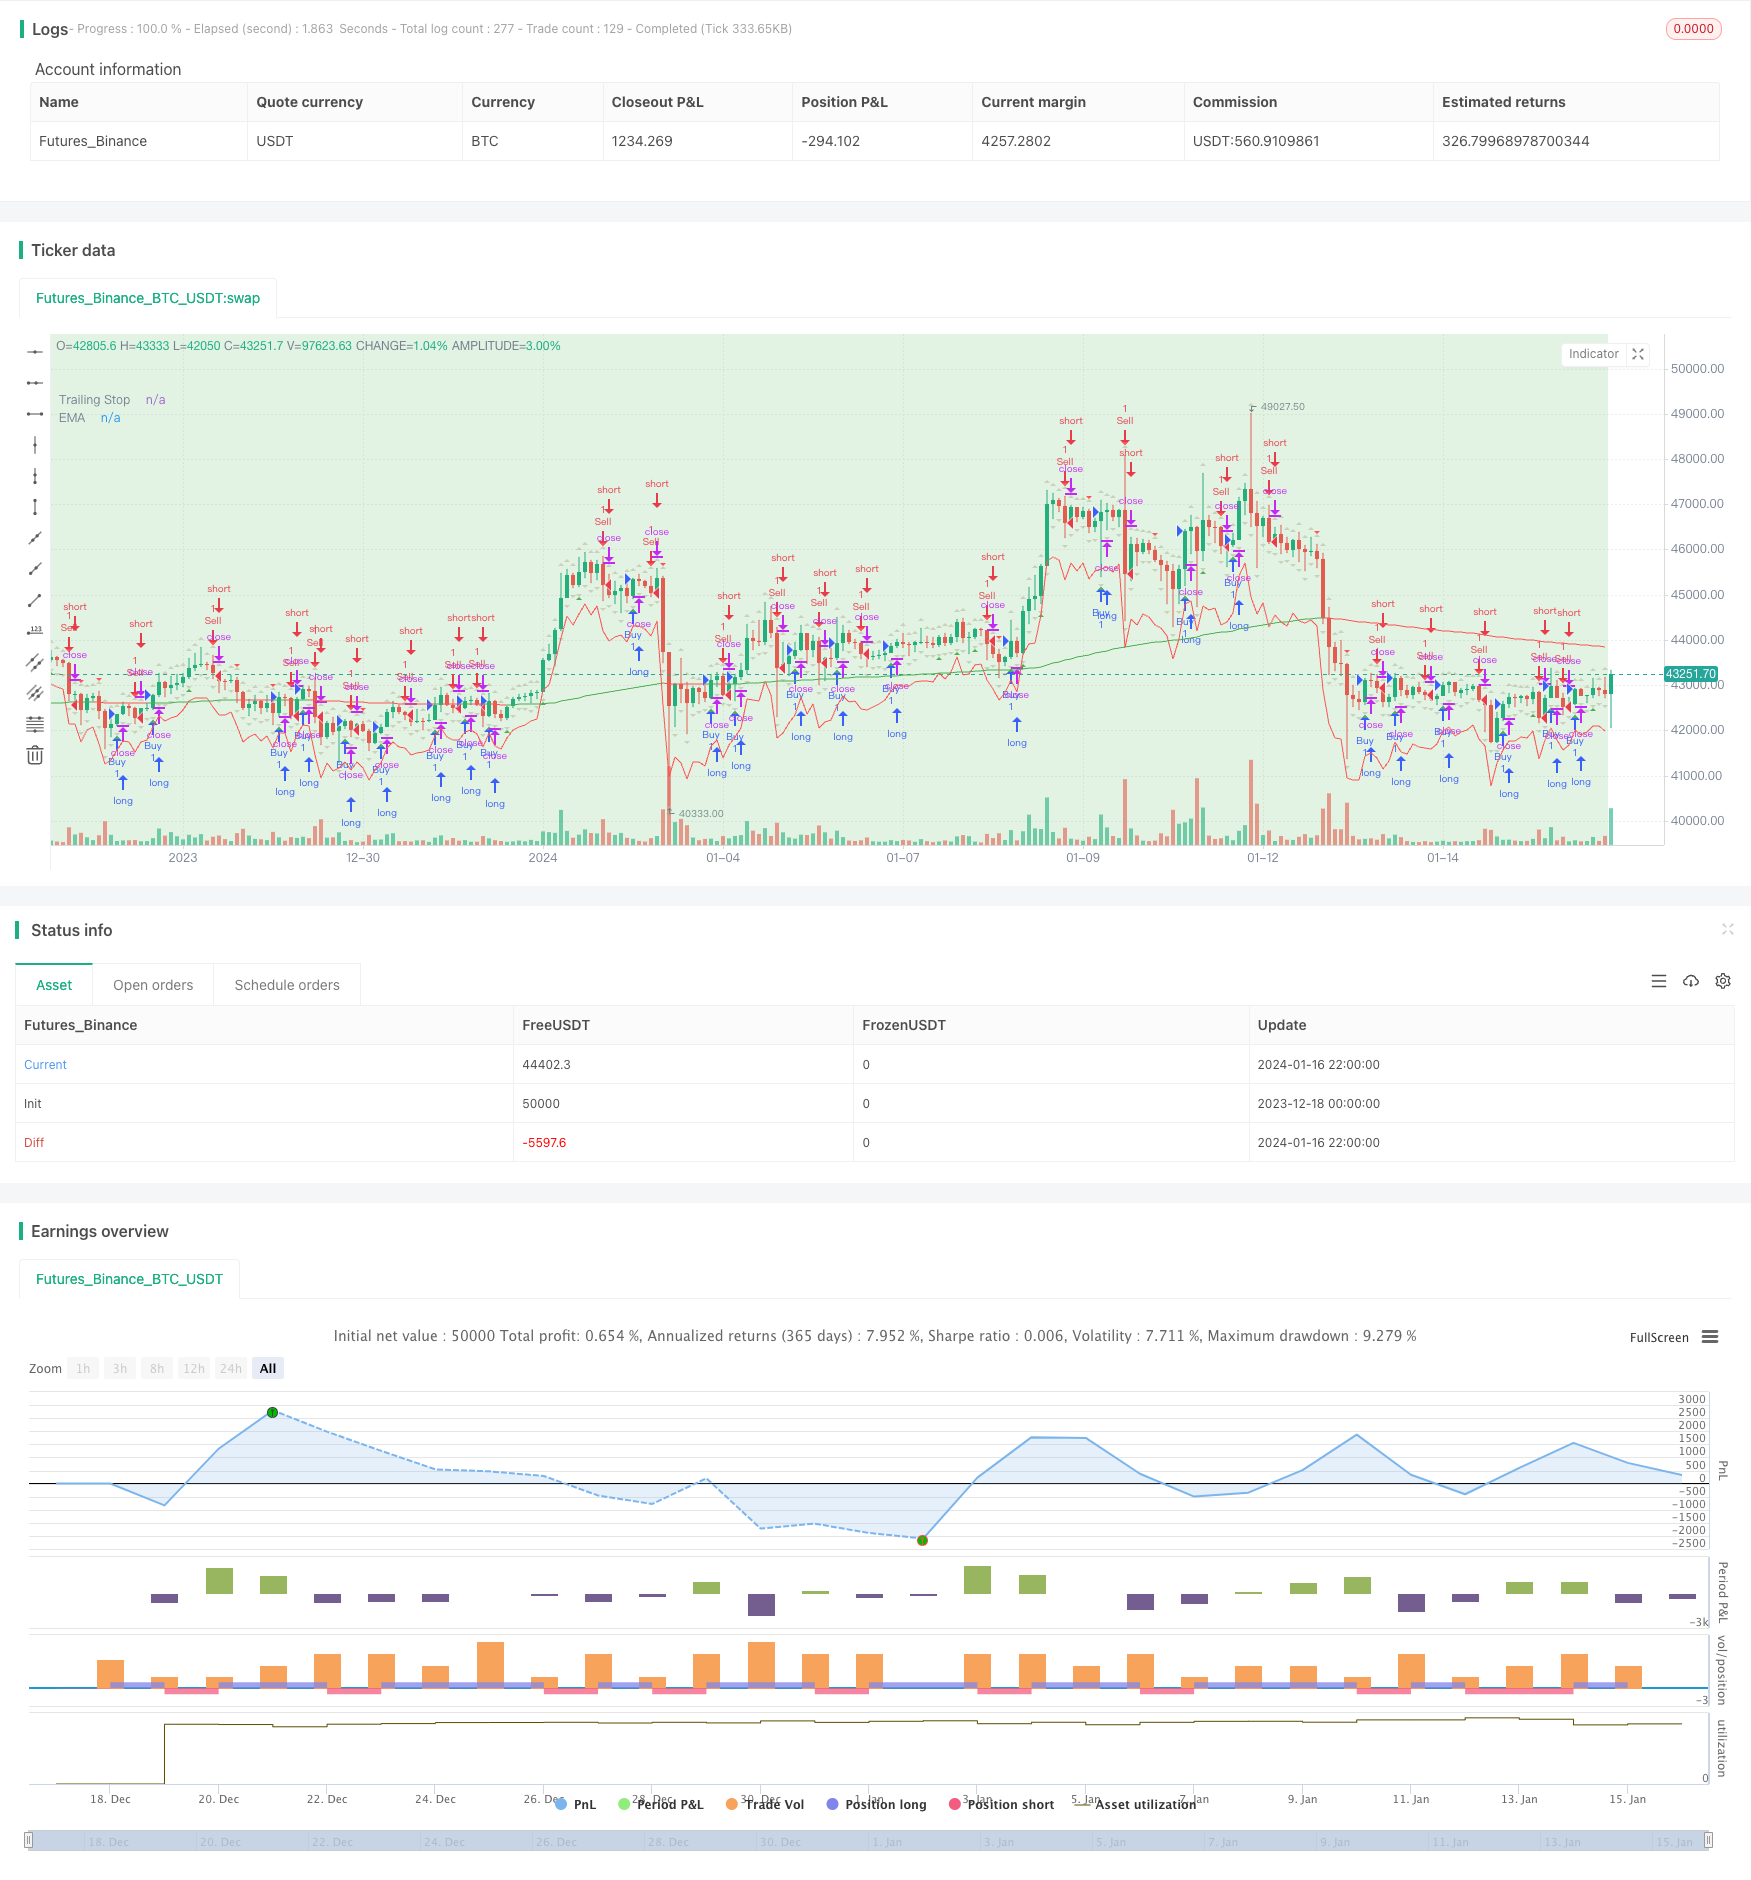
该策略综合运用趋势、反转、波动率等多种技术指标和价格形态判断,在回测中表现不俗。但是实盘复杂多变,优化和适当过滤入场信号仍有必要。该策略为基础策略,可在其基础上进行扩展,与其他因素或模型结合。
/*backtest
start: 2023-12-18 00:00:00
end: 2024-01-17 00:00:00
period: 2h
basePeriod: 15m
exchanges: [{"eid":"Futures_Binance","currency":"BTC_USDT"}]
*/

//@version=5
strategy("Supply and Demand Zones with EMA and Trailing Stop", shorttitle="SD Zones", overlay=true)

showBuySignals = input(true, title="Show Buy Signals", group="Signals")
showSellSignals = input(true, title="Show Sell Signals", group="Signals")
showHLZone = input(true, title="Show HL Zone", group="Zones")
showLHZone = input(true, title="Show LH Zone", group="Zones")
showHHZone = input(true, title="Show HH Zone", group="Zones")
showLLZone = input(true, title="Show LL Zone", group="Zones")

emaLength = input(200, title="EMA Length", group="EMA Settings")
atrLength = input(14, title="ATR Length", group="Trailing Stop")
atrMultiplier = input(2, title="ATR Multiplier", group="Trailing Stop")

// Function to identify supply and demand zones
getZones(src, len, mult) =>
    base = request.security(syminfo.tickerid, "D", close)
    upper = request.security(syminfo.tickerid, "D", high)
    lower = request.security(syminfo.tickerid, "D", low)
    multiplier = request.security(syminfo.tickerid, "D", mult)
    zonetype = base + multiplier * len
    zone = src >= zonetype
    [zone, upper, lower]

// Identify supply and demand zones
[supplyZone, _, _] = getZones(close, high[1] - low[1], 1)
[demandZone, _, _] = getZones(close, high[1] - low[1], -1)

// Plot supply and demand zones
bgcolor(supplyZone ? color.new(color.red, 80) : na)
bgcolor(demandZone ? color.new(color.green, 80) : na)

// EMA with Linear Weighted method
ema = ta.ema(close, emaLength)

// Color code EMA based on its relation to candles
emaColor = close > ema ? color.new(color.green, 0) : close < ema ? color.new(color.red, 0) : color.new(color.yellow, 0)

// Plot EMA
plot(ema, color=emaColor, title="EMA")

// Entry Signal Conditions after the third candle
longCondition = ta.crossover(close, high[1]) and bar_index >= 2
shortCondition = ta.crossunder(close, low[1]) and bar_index >= 2

// Trailing Stop using ATR
atrValue = ta.atr(atrLength)
trailStop = close - atrMultiplier * atrValue

// Strategy Entry and Exit
if (longCondition)
    strategy.entry("Buy", strategy.long)
    strategy.exit("TrailStop", from_entry="Buy", loss=trailStop)

if (shortCondition)
    strategy.entry("Sell", strategy.short)
    strategy.exit("TrailStop", from_entry="Sell", loss=trailStop)

// Plot Entry Signals
plotshape(series=showBuySignals ? longCondition : na, title="Buy Signal", color=color.new(color.green, 0), style=shape.triangleup, location=location.belowbar)
plotshape(series=showSellSignals ? shortCondition : na, title="Sell Signal", color=color.new(color.red, 0), style=shape.triangledown, location=location.abovebar)

// Plot Trailing Stop
plot(trailStop, color=color.new(color.red, 0), title="Trailing Stop")

// Plot HH, LL, LH, and HL zones
plotshape(series=showHHZone and ta.highest(high, 2)[1] and ta.highest(high, 2)[2] ? 1 : na, title="HH Zone", color=color.new(color.blue, 80), style=shape.triangleup, location=location.abovebar)
plotshape(series=showLLZone and ta.lowest(low, 2)[1] and ta.lowest(low, 2)[2] ? 1 : na, title="LL Zone", color=color.new(color.blue, 80), style=shape.triangledown, location=location.belowbar)
plotshape(series=showLHZone and ta.highest(high, 2)[1] and ta.lowest(low, 2)[2] ? 1 : na, title="LH Zone", color=color.new(color.orange, 80), style=shape.triangleup, location=location.abovebar)
plotshape(series=showHLZone and ta.lowest(low, 2)[1] and ta.highest(high, 2)[2] ? 1 : na, title="HL Zone", color=color.new(color.orange, 80), style=shape.triangledown, location=location.belowbar)