Bitcoin and Gold 5-Minute Scalping Strategy 2.0

Overview
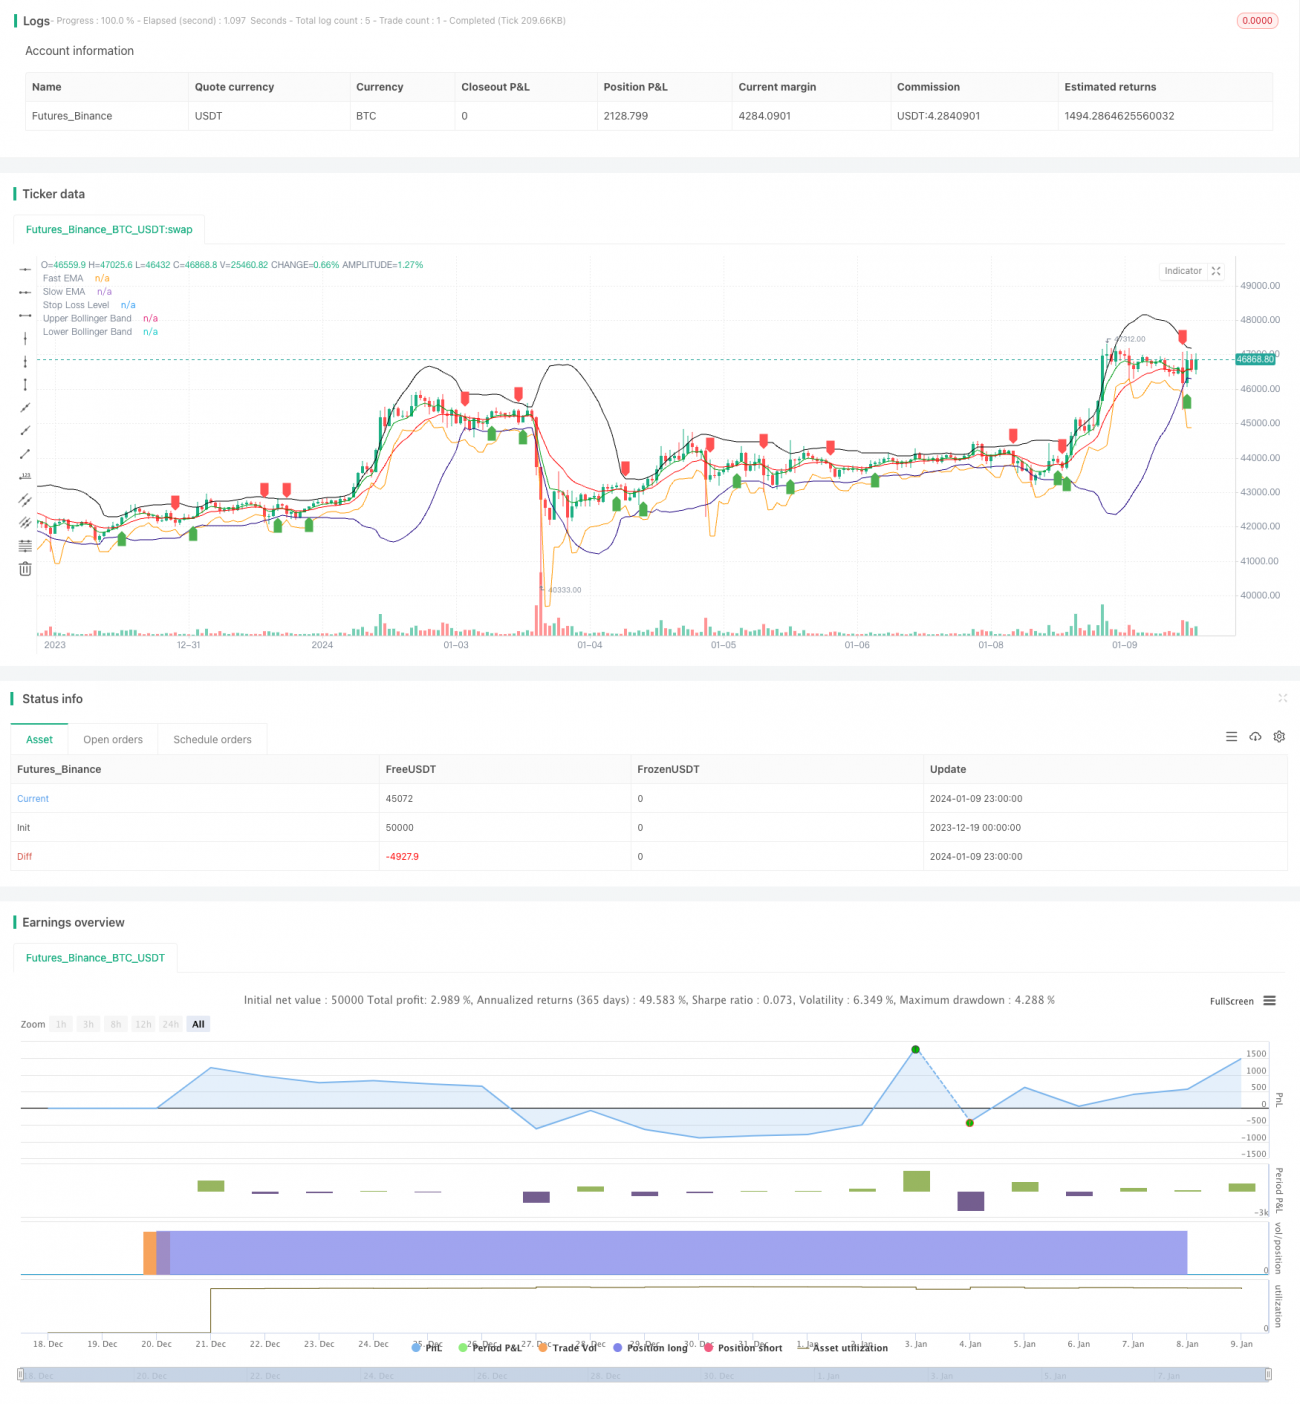
This is a 5-minute scalping strategy aimed at capturing short-term price swings and volatility in the Bitcoin and Gold markets to generate profits. It combines the use of EMA lines, Bollinger Bands indicator and stop loss methods to enter and exit trades.
Strategy Logic
The strategy uses fast EMA and slow EMA indicators to build a trend judgment system. A buy signal is generated when the fast EMA crosses above the slow EMA; A sell signal is generated when the fast EMA crosses below the slow EMA, capturing the turn of short-term trends.
At the same time, the strategy incorporates Bollinger Bands indicator to judge the price fluctuation range. Trading signals are only generated when the price is close to the upper or middle rail of the Bollinger Bands. This filters out most false signals.
After entering the market, the strategy uses the ATR indicator to calculate the stop loss price. The stop loss is set at the low of the entry bar minus n times ATR, which is used to control the risk of each trade.
Advantage Analysis
The biggest advantage of this strategy is capturing short-term swings and price volatility, taking small but consistent profits every time. The combination of fast EMA and slow EMA can quickly determine short-term trends; Bollinger Bands and ATR stop loss can effectively control risks, making it a relatively stable scalping strategy.
In addition, the 5-minute timeframe leads to a higher trading frequency, which also expands its profit potential. It also facilitates manual monitoring or optimization.
Risk Analysis
The main risk of this strategy comes from whipsaws leading to multiple small losses. When the price oscillates within a range, EMA crossover signals may occur frequently, resulting in unnecessary trades and consecutive small losses.
In addition, as a short-term scalping strategy, it also faces the risk of trading costs brought about by high trading frequency. Excessively high trading costs could erode profit margins.
Optimization Directions
The strategy can be optimized in the following ways:
-
Add other oscillators as auxiliary judgment indicators, such as RSI, Stochastics, etc., to avoid being trapped in oscillating markets.
-
Increase machine learning models to judge trend direction and improve entry accuracy.
-
Use genetic algorithms, random forests and other methods to automatically optimize parameters to better fit current market conditions.
-
Incorporate deep learning to determine key support and resistance levels and set better stop loss positions.
-
Test different trading vehicles such as stock indices, forex, cryptocurrencies, etc., and select the one with the best trading performance as the main trading vehicle.
Conclusion
In summary, as a short-term frequent trading strategy, this strategy can effectively capture short-term price swings and trend reversals by using fast EMA to judge, Bollinger Bands to filter and ATR for stop loss to control risks, allowing steady gains. If further optimized and improved to reduce trading frequency while maintaining profitability, it will be a highly promising quantitative strategy.
- 1