概述
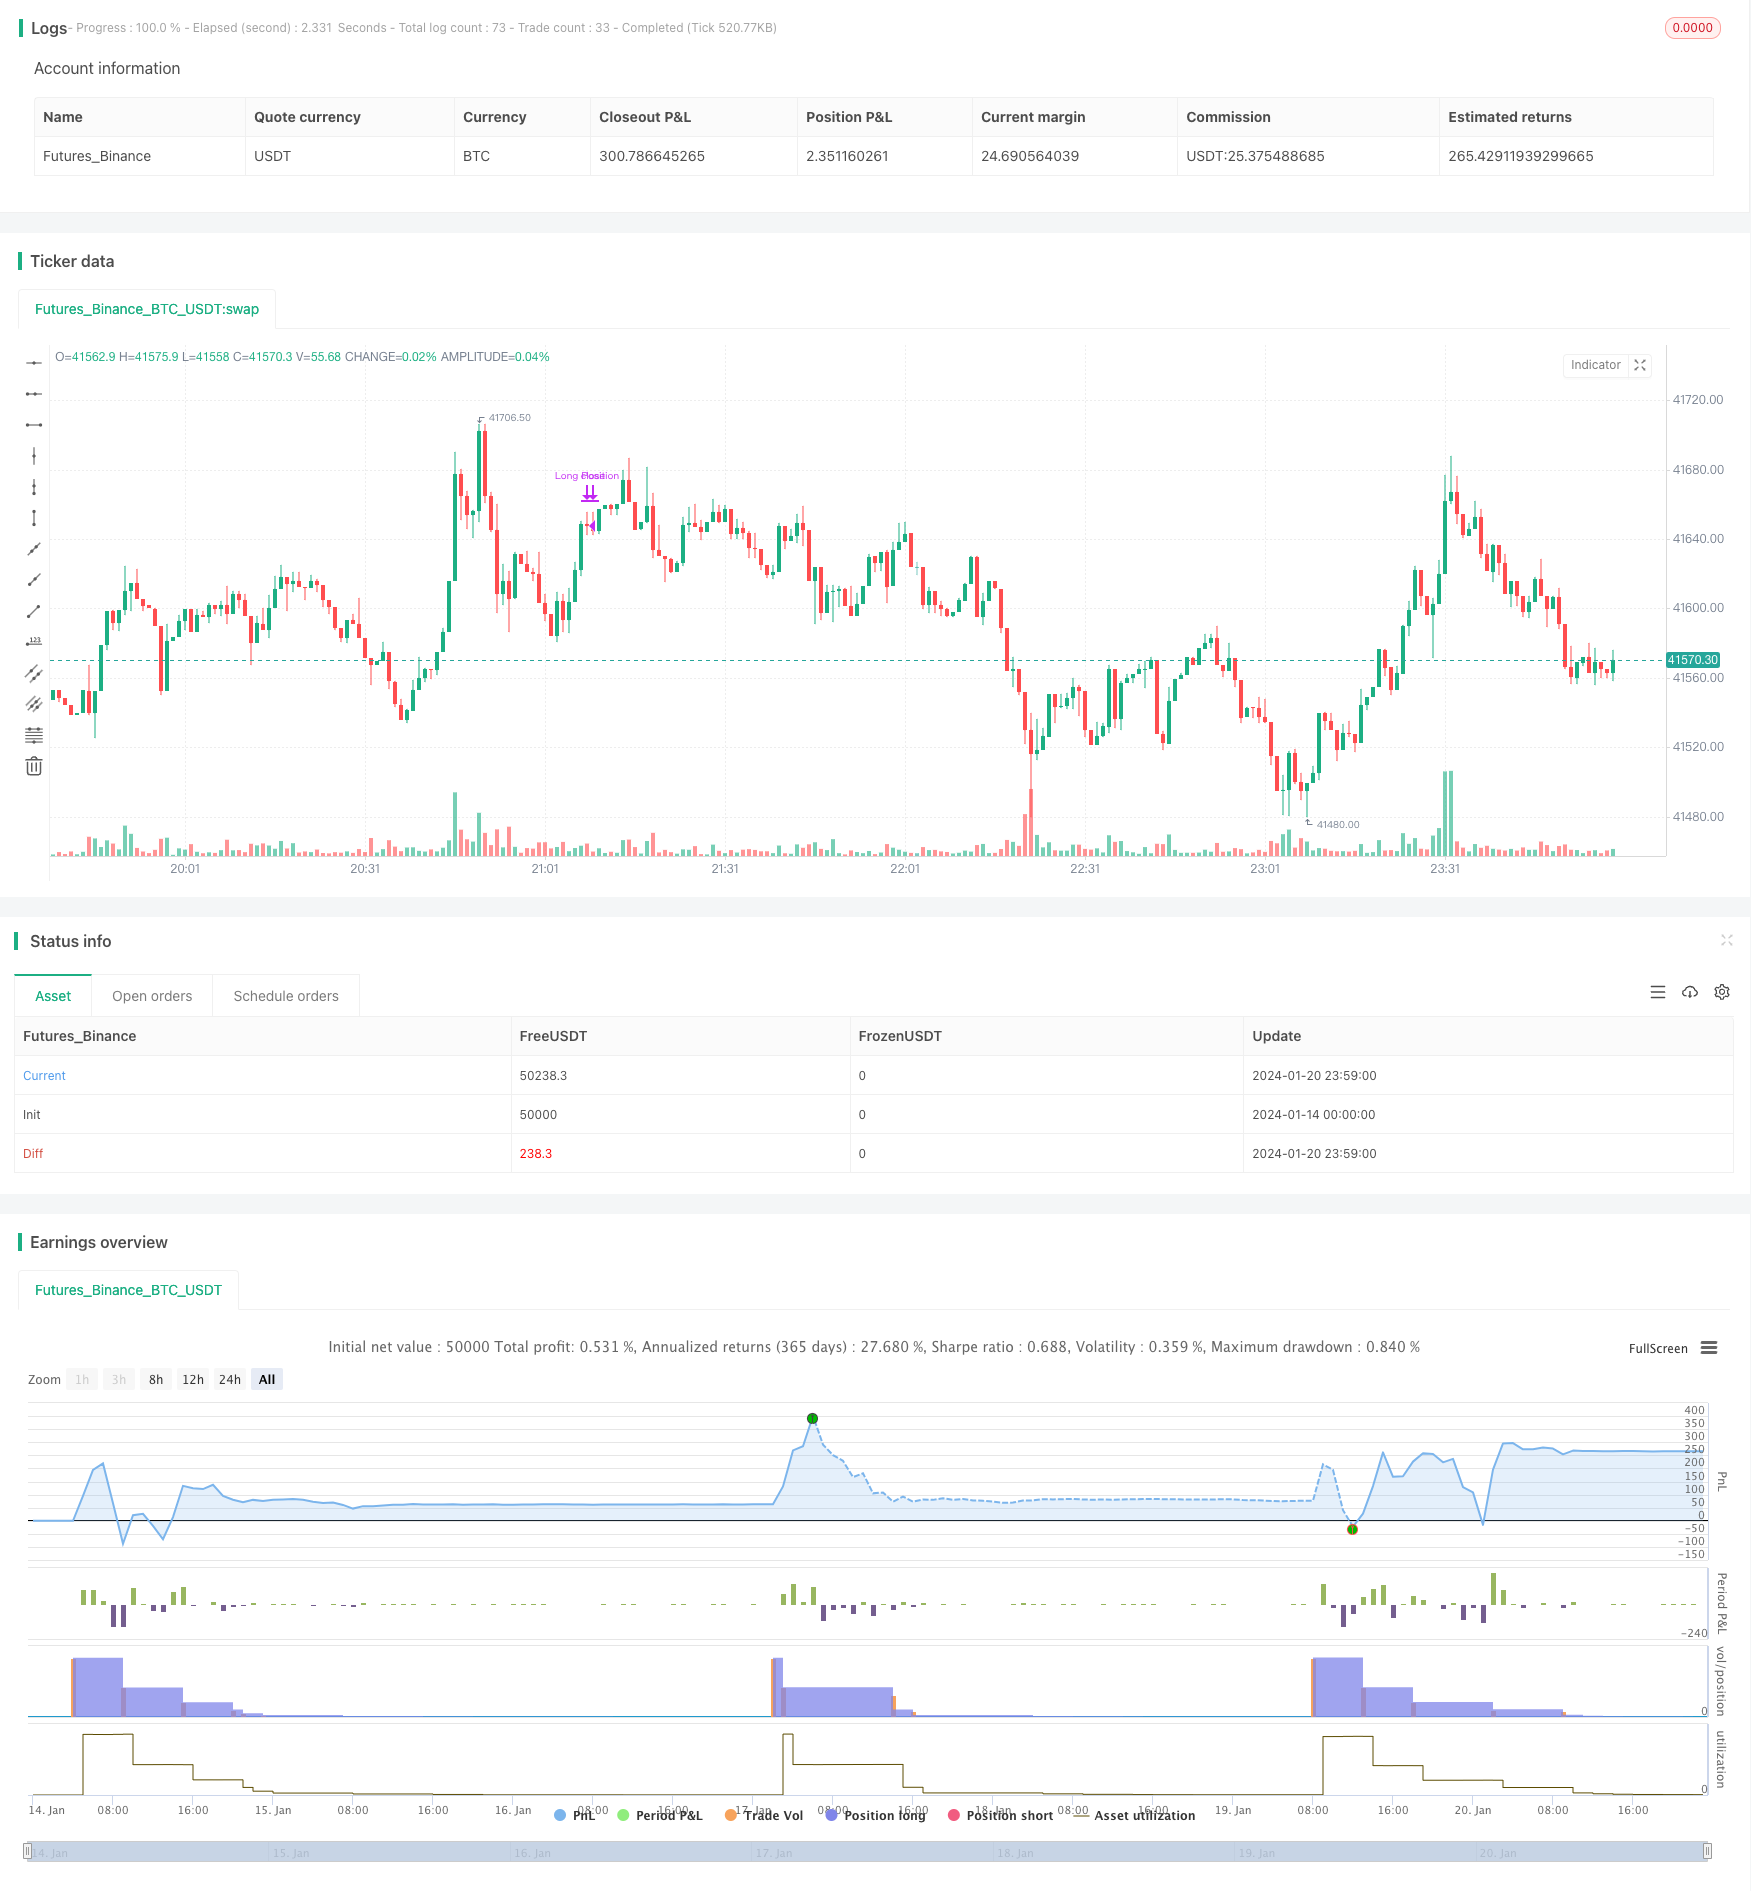
该策略通过结合布林带、随机振荡器和相对强弱指数等多重技术指标,设定买入信号和卖出信号,实现对加密货币等资产的长线追踪操作。策略名称定为“多因子加密货币量化策略”。
策略原理
策略首先设置布林带、随机振荡器和RSI等指标的计算参数。然后定义买入信号条件为:收盘价低于布林带下轨,K线低于20且高于D线,RSI低于30。当同时满足这三个条件时,进行 longing。定义部分卖出信号为:K线高于70且前一周期低于70(金叉死叉),且存在RSI背离。当满足这两个条件时,平仓50%。
优势分析
该策略结合多重指标判断市场状况,避免单一指标造成的误判。布林带判断是否处于超跌,随机振荡器判断是否处于超卖,RSI判断是否处于超oversold。多重指标共同作用,可以有效识别市场低谷,精确做多。此外,策略还利用RSI背离来判断潜在趋势反转,防止止损过晚。所以,该策略可以较好地把握低买高卖的机会。
风险分析
该策略依赖参数优化,如果参数设置不当,将无法正确识别低谷和高峰。此外,指标之间可能存在错误组合的情况。例如布林带识别超跌,但其他指标并未达到相应条件的情况。这些情况都可能导致不必要的亏损。最后,策略并没有考虑最大回撤和仓位管理问题,这也是需要优化的方向。
优化方向
对指标参数进行测试和优化,找到最佳参数组合。
增加最大回撤控制,当达到阈值时暂停交易。
加入仓位管理模块,根据市场情况动态调整仓位。初期仓位较小,后期可加大仓位。
添加止损策略。当市场方向判断错误时,设定合理止损点,控制单笔损失。
总结
该策略整体思路清晰,通过多重指标判断,对低谷高峰的抓取能力较强。但部分参数和模块还有优化空间,适当调整后,可以成为一个稳定收益的量化策略。
策略源码
/*backtest
start: 2024-01-14 00:00:00
end: 2024-01-21 00:00:00
period: 1m
basePeriod: 1m
exchanges: [{"eid":"Futures_Binance","currency":"BTC_USDT"}]
*/

//@version=5
strategy("Stratégie d'Entrée et de Sortie Longue", overlay=true)

// Paramètres des indicateurs
longueurBollinger = 20
stdDevBollinger = 2
longueurStochastic = 14
smoothK = 3
smoothD = 3
longueurRSI = 14

// Bollinger Bands
basis = ta.sma(close, longueurBollinger)
dev = ta.stdev(close, longueurBollinger)
lowerBand = basis - stdDevBollinger * dev

// Stochastic Oscillator
k = ta.sma(ta.stoch(close, high, low, longueurStochastic), smoothK)
d = ta.sma(k, smoothD)

// RSI
rsi = ta.rsi(close, longueurRSI)

// Logique des autres indicateurs (à compléter)

// Conditions d'entrée (à définir)
conditionBollinger = close < lowerBand
conditionStochastic = k < 20 and k > d
conditionRSI = rsi < 30
// Autres conditions (Braid Filter, VolumeBIS, Price Density...)

conditionEntree = conditionBollinger and conditionStochastic and conditionRSI // et autres conditions

// Exécution du trade (entrée)
if (conditionEntree)
    strategy.entry("Long Position", strategy.long)

// Conditions de sortie
stochCrossOver70 = k > 70 and k[1] <= 70

// Simplification de la détection de divergence baissière
// (Cette méthode est basique et devrait être raffinée pour une analyse précise)
highsRising = high > high[1]
lowsRising = low > low[1]
rsiFalling = rsi < rsi[1]
divergenceBearish = highsRising and lowsRising and rsiFalling

// Clôturer la moitié de la position
if (stochCrossOver70 and divergenceBearish)
    strategy.close("Long Position", qty_percent = 50)