概述
该策略采用双指数移动平均线交叉和相对强弱指标的组合来识别市场中的潜在交易机会。它适用于追踪更大的价格走势和波动的交易者。
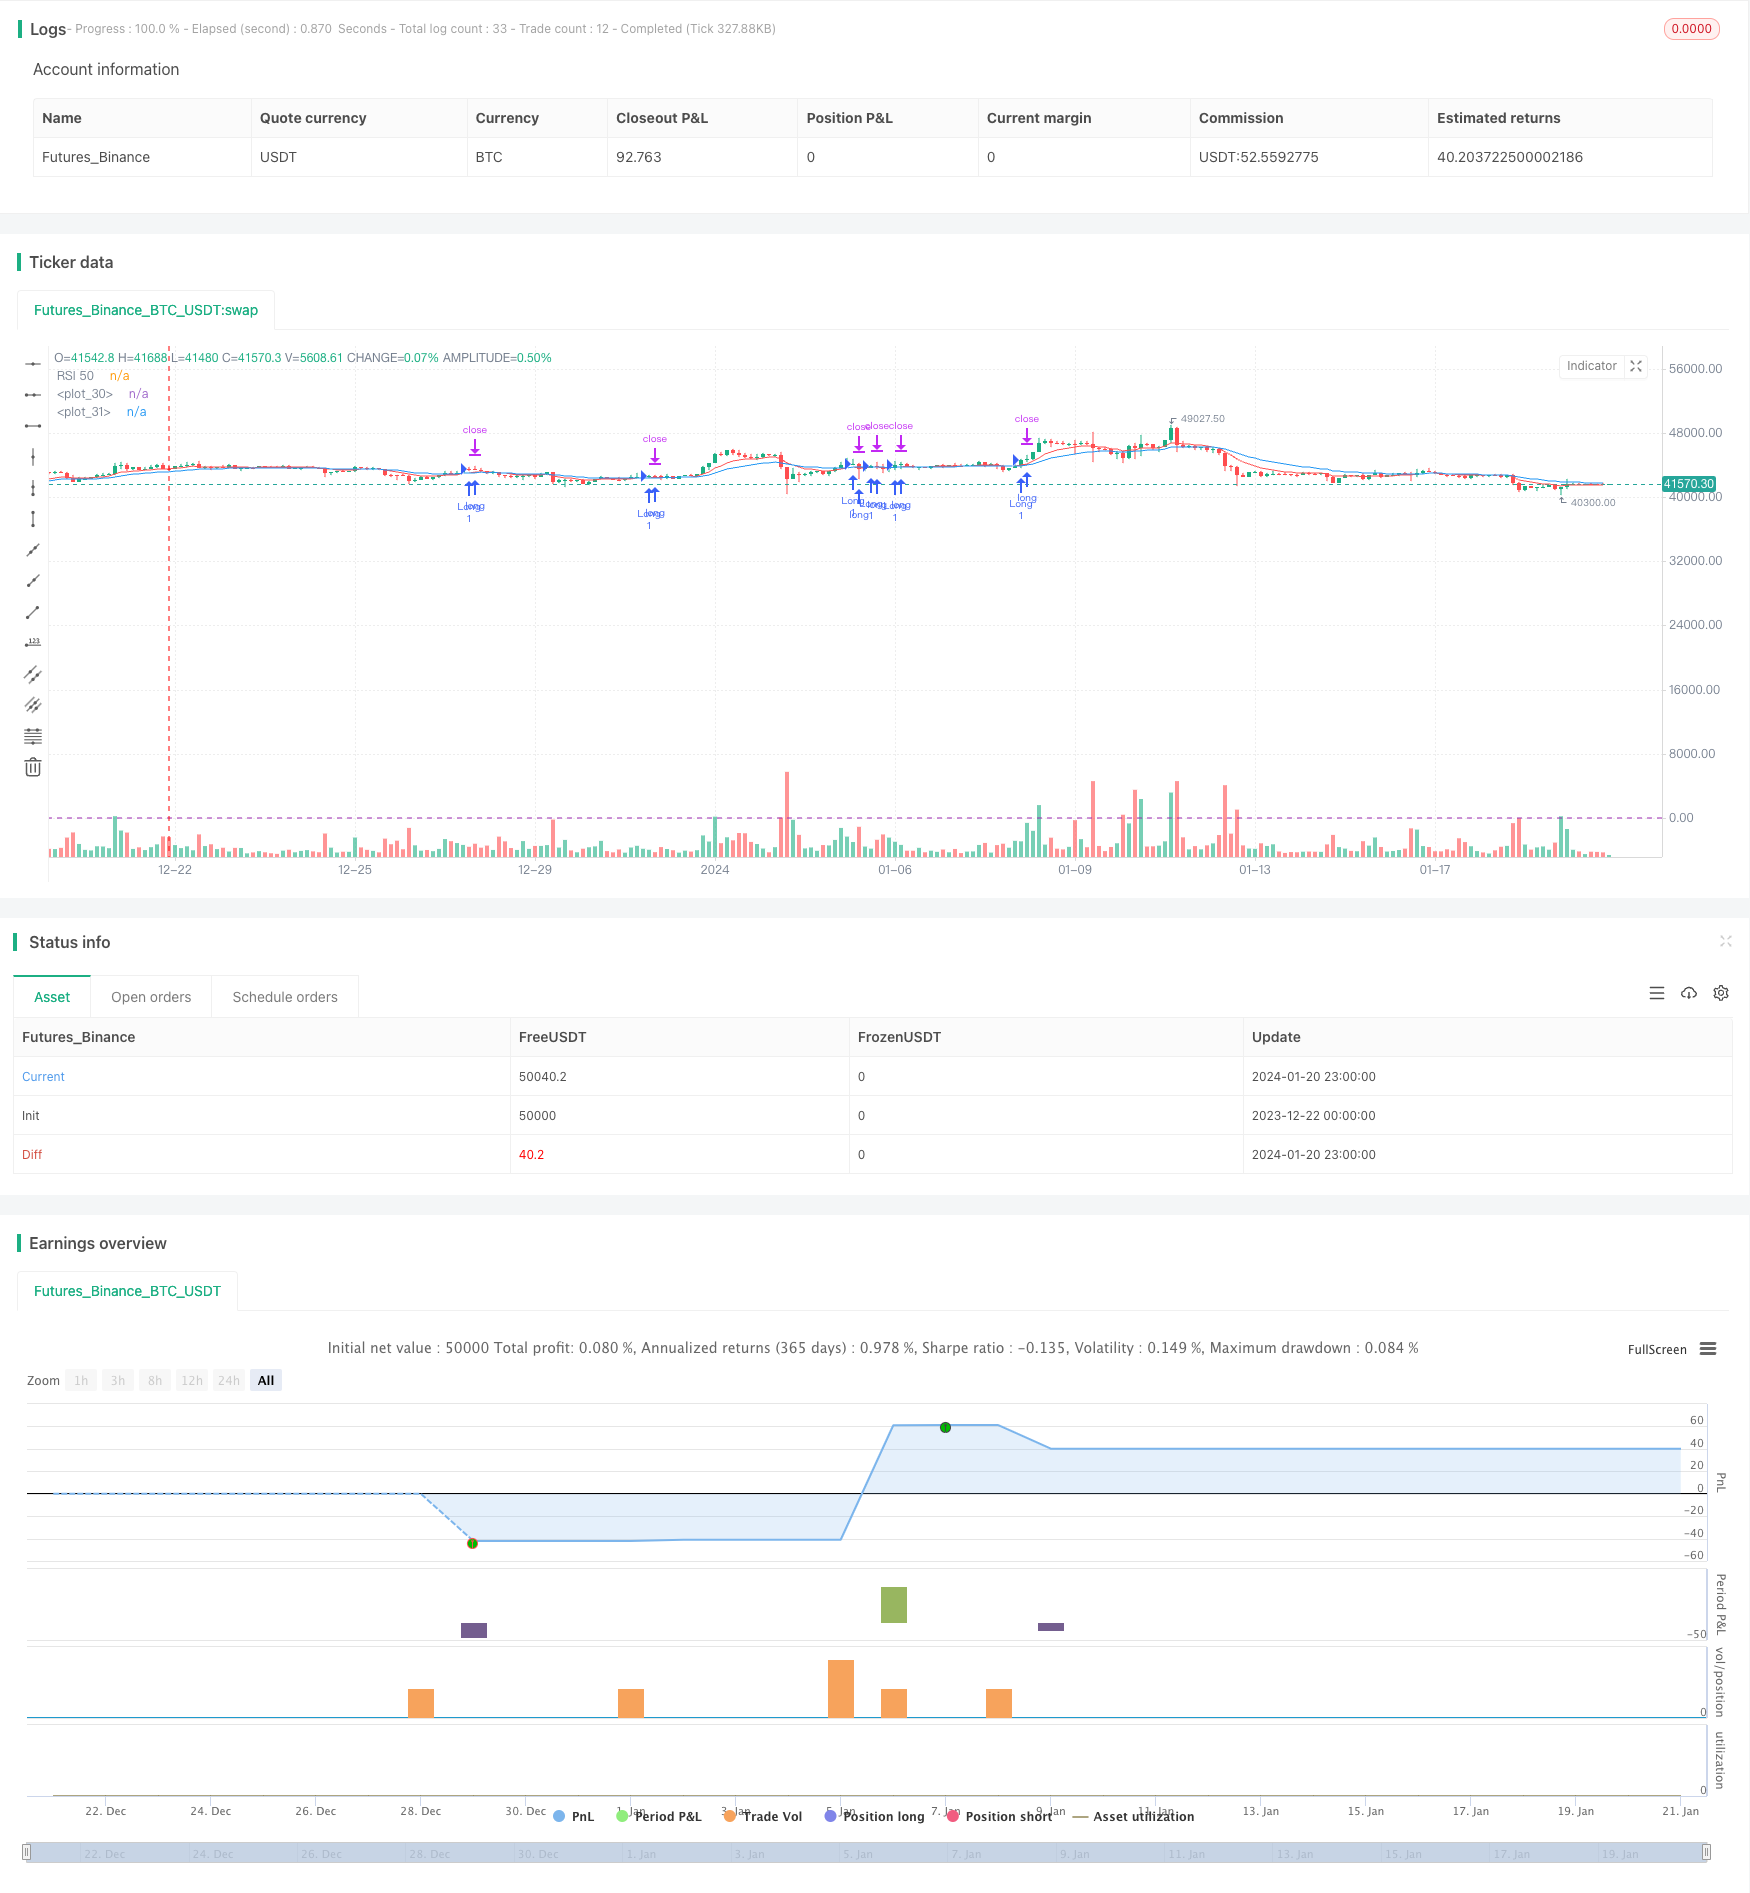
策略原理
核心思想是当快速的9周指数移动平均线向上突破更慢的21周指数移动平均线时,买入,因为这表明市场趋势可能正在变强。然后,如果RSI大于50,就确认买入信号,因为这意味着价格上涨势头正强。
具体来说,当9周EMA上穿21周EMA,并且14周RSI大于50时,发出买入信号。然后使用2%的账户风险开仓,5%止损,10%止盈。还有3%的跟踪止损来锁定利润。
卖出信号基于相反逻辑:如果9周EMA下穿21周EMA或RSI低于50。这表示短期趋势已经改变方向为下跌。
策略优势
- 使用双重技术指标识别潜在机会,提高信号质量
- RSI有助于确认趋势和过滤假突破
- 适合追踪更大的价格波动
- 风险管理设置了止损和止盈
- 跟踪止损可以优化收益保护
策略风险
- 快速均线交叉可能会产生更多交易噪音
- RSI发出错误信号的可能性
- 盈亏比受限制在2:1
- 未考虑到交易成本
- 大量参数需要优化,如移动平均线周期长度、RSI参数等
可以通过系统地测试这些参数的组合来优化。还可以在条件逻辑中添加过滤器来减少噪音交易。考虑基本面因素可以提供更多的确认。
优化方向
- 测试EMA周期参数寻找最佳组合
2.优化RSI参数减少错误信号
- 添加额外确认指标如Bollinger带宽度
- 结合基本面分析提高信号质量
- 策略可以扩展至多个时间范围如日内交易
总结
该策略利用了EMA和RSI的力量来识别中长期趋势中的潜在机会。它提供了清晰的风险管理规则,可以有效控制每笔交易的风险。通过进一步测试和优化参数,可以继续提高策略表现。它为追踪市场中大的周期性波动提供了一个有效的方法。
策略源码
/*backtest
start: 2023-12-22 00:00:00
end: 2024-01-21 00:00:00
period: 3h
basePeriod: 15m
exchanges: [{"eid":"Futures_Binance","currency":"BTC_USDT"}]
*/

//@version=4
strategy("Weekly Swing Trading Strategy", overlay=true)

// Entry Indicators
shortEma = ema(close, 9)
longEma = ema(close, 21)
rsiValue = rsi(close, 14)

// Entry Condition
longCondition = crossover(shortEma, longEma) and rsiValue > 50
if (longCondition)
    strategy.entry("Long", strategy.long)

// Position Sizing (2% risk per trade)
riskPerTrade = 0.02
stopLossPercent = 0.05 // 5% stop loss
stopLossPrice = close * (1 - stopLossPercent)
strategy.exit("Stop Loss", "Long", stop=stopLossPrice)

// Profit Target and Trailing Stop
profitTargetPercent = 0.10 // 10% profit target
profitTargetPrice = close * (1 + profitTargetPercent)
trailStopPercent = 0.03 // 3% trailing stop
strategy.exit("Take Profit", "Long", limit=profitTargetPrice, trail_price=trailStopPercent, trail_offset=trailStopPercent)

// Exit Strategy
exitCondition = crossunder(shortEma, longEma) or rsiValue < 50 // Exit when EMAs cross or RSI drops below 50
strategy.close("Long", when=exitCondition)

plot(shortEma, color=color.red)
plot(longEma, color=color.blue)
hline(50, "RSI 50", color=color.purple)