概述
本策略是一个基于相对强弱指数(RSI)的反转趋势追踪ETF交易策略。它通过RSI指标判断短期超买超卖现象,进行反转entries和exits。同时结合200日移动平均线来判断整体趋势方向。
策略原理
该策略的核心逻辑基于RSI指标的反转原理。RSI指标通过计算一段时间内的平均涨跌幅度,来判断该交易品种是否处于超买或超卖状态。当RSI高于70时代表超买,RSI低于30时代表超卖。这时就有可能出现反转行情。
本策略利用此原理,设定了当日RSI低于可调参数TodaysMinRSI,且3天前RSI低于可调参数Day3RSIMax时,可以进行买入。这表示价格可能处于短期超卖区域,有反弹的可能。同时要求3天内RSI呈下降趋势,即RSI持续下滑才买入,避免假反弹。
策略的退出机制是当RSI指标再次超过可调参数Exit RSI的阈值时,认为反弹结束,此时进行平仓退出。
该策略还引入200日移动平均线作为整体趋势判断。只有当价格高于200日线时,才可以进行买入操作。这有助于确保只在趋势向上阶段买入,避免逆势交易带来的风险。
策略优势分析
- 利用RSI指标判断超买超卖区域,bellion的可能性大。
- 结合200日线判断大趋势方向,有助于避免逆势交易。
- RSI反转交易原理经典且可靠,成功率高。
- 可调参数提供灵活性,可以针对不同品种进行优化。
风险及解决方法
- RSI指标存在假突破的可能,无法完全避免亏损单。可以设置止损来控制单笔损失。
- 反转失败可能导致亏损扩大。可以缩短持仓时间,及时止损退出。
- 参数设置不当可能导致过于激进,也可能过于保守从而错过交易机会。必须针对品种进行参数优化测试。
优化方向
- 增加其他指标结合,如KDJ、布林带等,形成指标组合,提高信号的准确性。
- 增加移动止损策略,让止损水平可变,减少亏损。
- 增加交易量或资金管理模块,控制每个交易的风险敞口。
- 针对不同品种参数进行优化和回测,制定适应该品种的参数组合。
总结
本策略利用RSI指标的经典买卖点原理,通过判断超买超卖区域进行反转entries和exits。同时考虑大趋势判断和参数优化空间,是一个可靠性较高的短期反转ETF策略。通过进一步优化,可以成为具有实战效果的量化策略。
策略源码
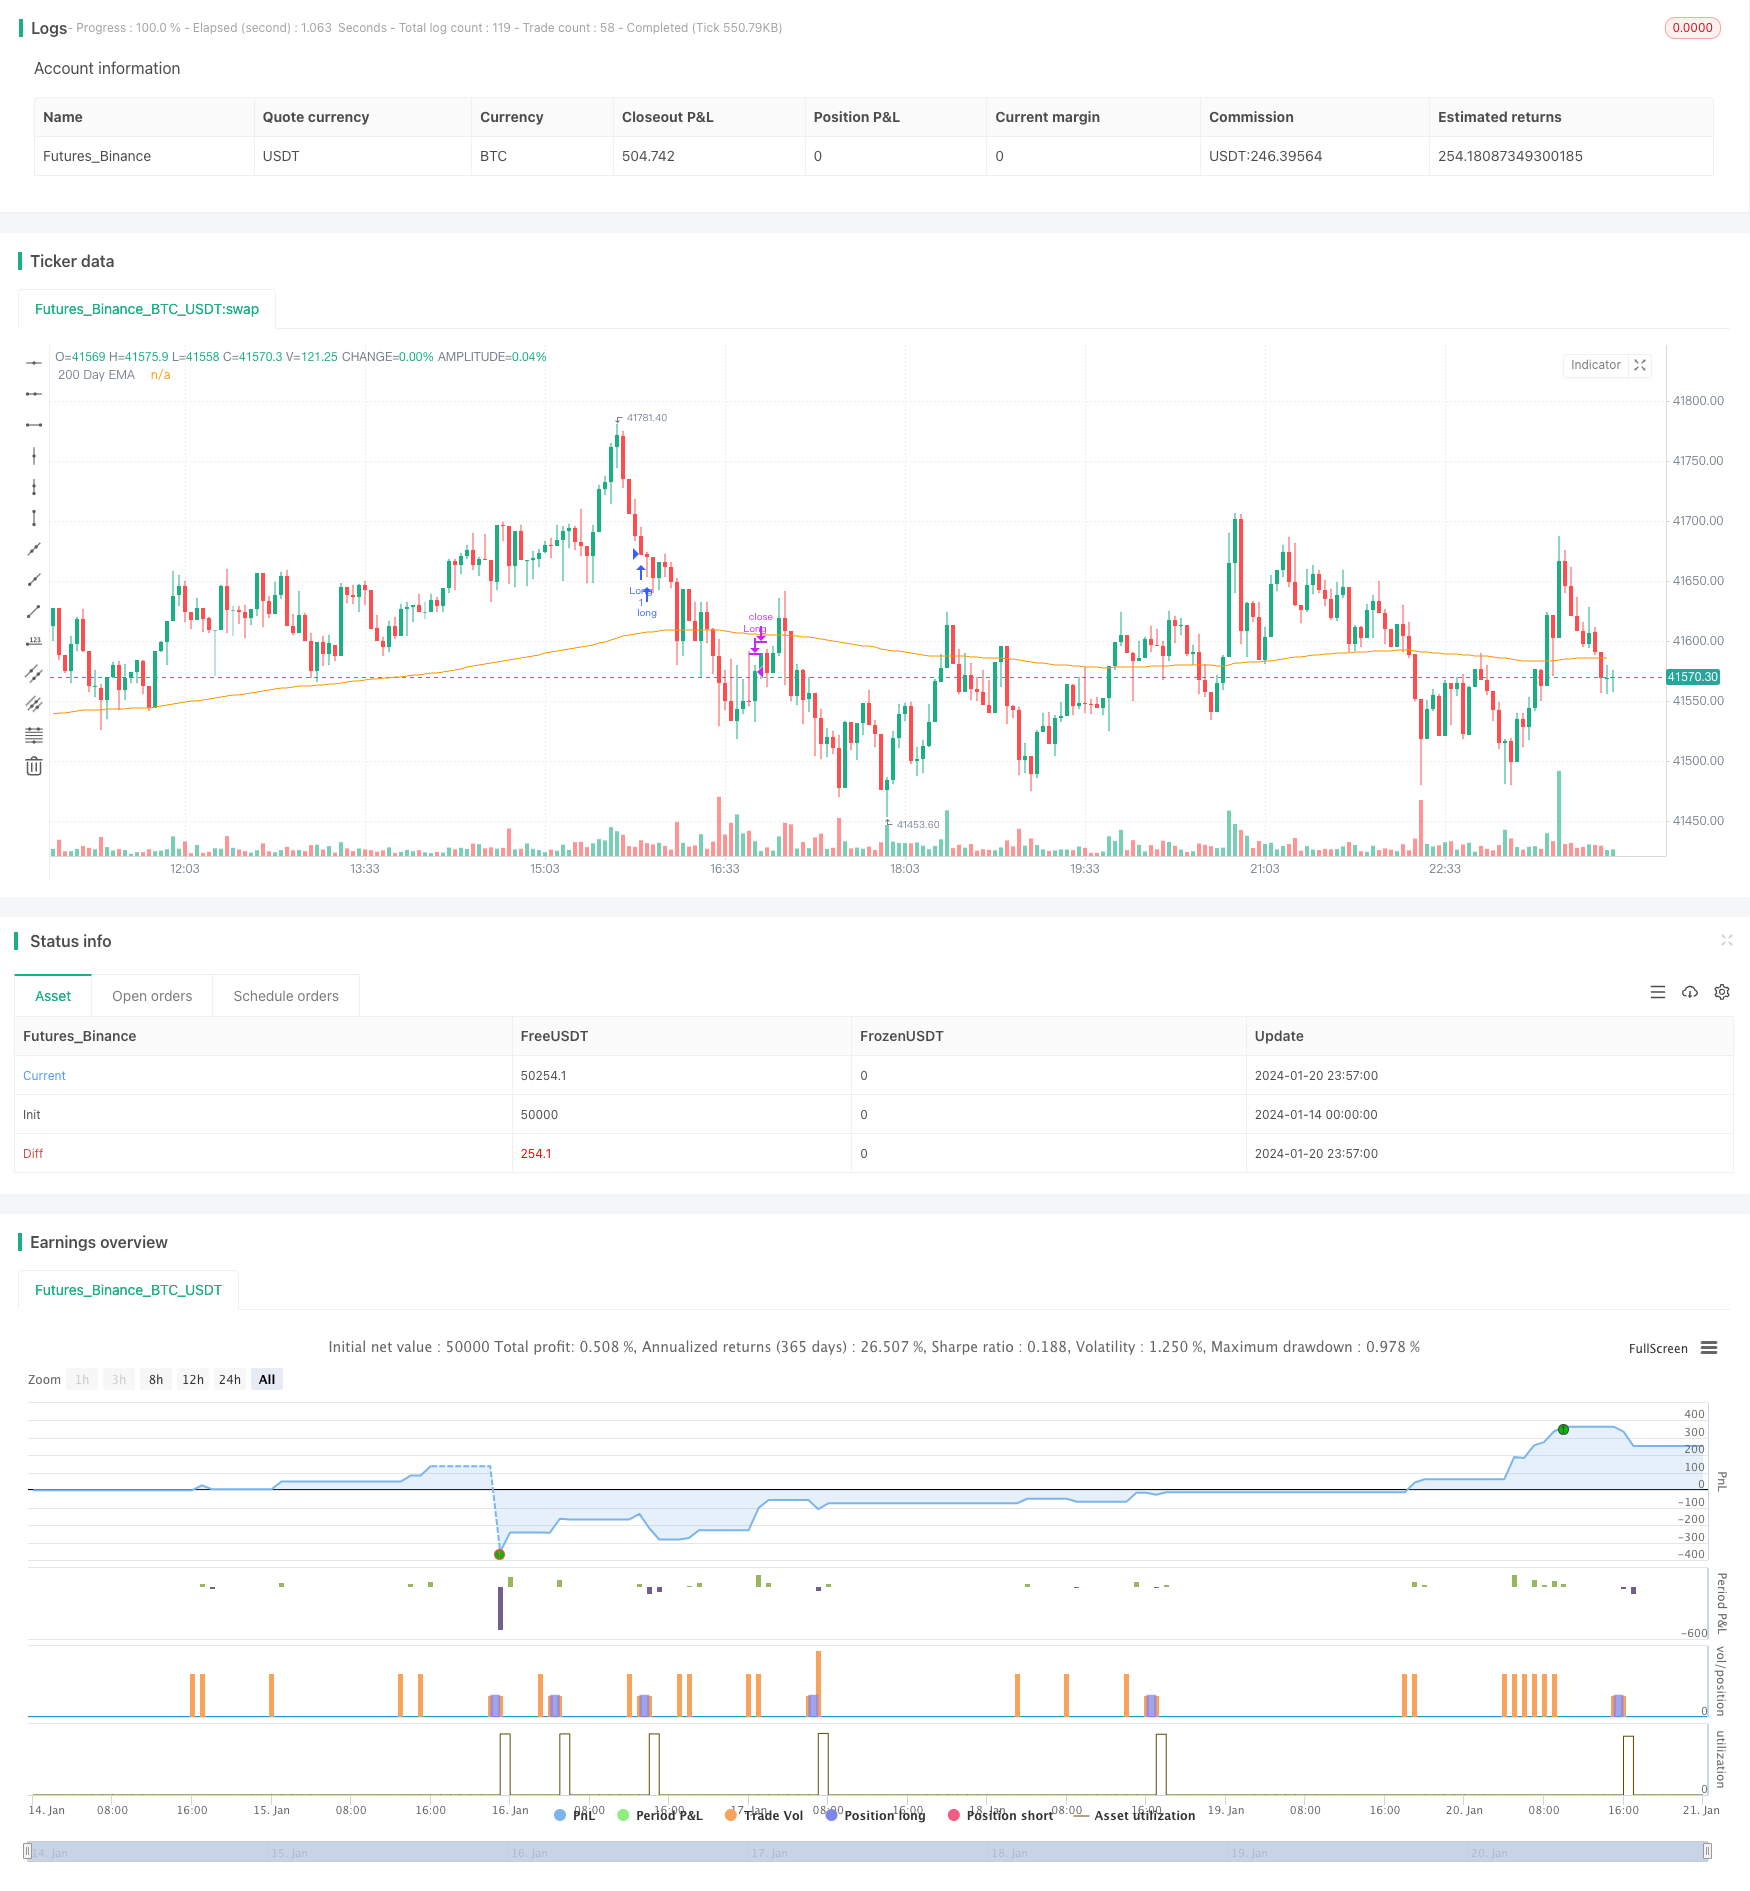
/*backtest
start: 2024-01-14 00:00:00
end: 2024-01-21 00:00:00
period: 3m
basePeriod: 1m
exchanges: [{"eid":"Futures_Binance","currency":"BTC_USDT"}]
*/

// This source code is subject to the terms of the Mozilla Public License 2.0 at https://mozilla.org/MPL/2.0/
// @version = 5
// Author = TradeAutomation


strategy(title="R3 ETF Strategy", shorttitle="R3 ETF Strategy", overlay=true)


// Backtest Date Range Inputs //
StartTime = input(defval=timestamp('01 Jan 2012 05:00 +0000'), title='Start Time')
EndTime = input(defval=timestamp('01 Jan 2099 00:00 +0000'), title='End Time')
InDateRange = true

// Calculations and Inputs //
RSILen = input.int(2, "RSI Length")
RSI = ta.rsi(close, RSILen)
TodaysMinRSI = input.int(10, "Today's Min RSI for Entry", tooltip = "The RSI must be below this number today to qualify for trade entry")
Day3RSIMax = input.int(60, "Max RSI 3 Days Ago for Entry", tooltip = "The RSI must be below this number 3 days ago to qualify for trade entry")
EMA = ta.ema(close, 200)

// Strategy Rules //
Rule1 = close>ta.ema(close, 200)
Rule2 = RSI[3]<Day3RSIMax and RSI<TodaysMinRSI
Rule3 = RSI<RSI[1] and RSI[1]<RSI[2] and RSI[2]<RSI[3]
Exit = ta.crossover(RSI, input.int(70, "Exit RSI", tooltip = "The strategy will sell when the RSI crosses over this number"))

// Plot //
plot(EMA, "200 Day EMA")

// Entry & Exit Functions //
if (InDateRange)
    strategy.entry("Long", strategy.long, when = Rule1 and Rule2 and Rule3)
//    strategy.close("Long", when = ta.crossunder(close, ATRTrailingStop))
    strategy.close("Long", when = Exit)
if (not InDateRange)
    strategy.close_all()