概述
动态动量震荡器交易策略(Dynamic Momentum Oscillator Trading Strategy)基于E. Marshall Wall在1996年7月《期货》杂志上发表的文章中提出的动态动量震荡器(Dynamo)指标,对标准震荡器进行了正常化处理,以消除趋势的影响。
策略原理
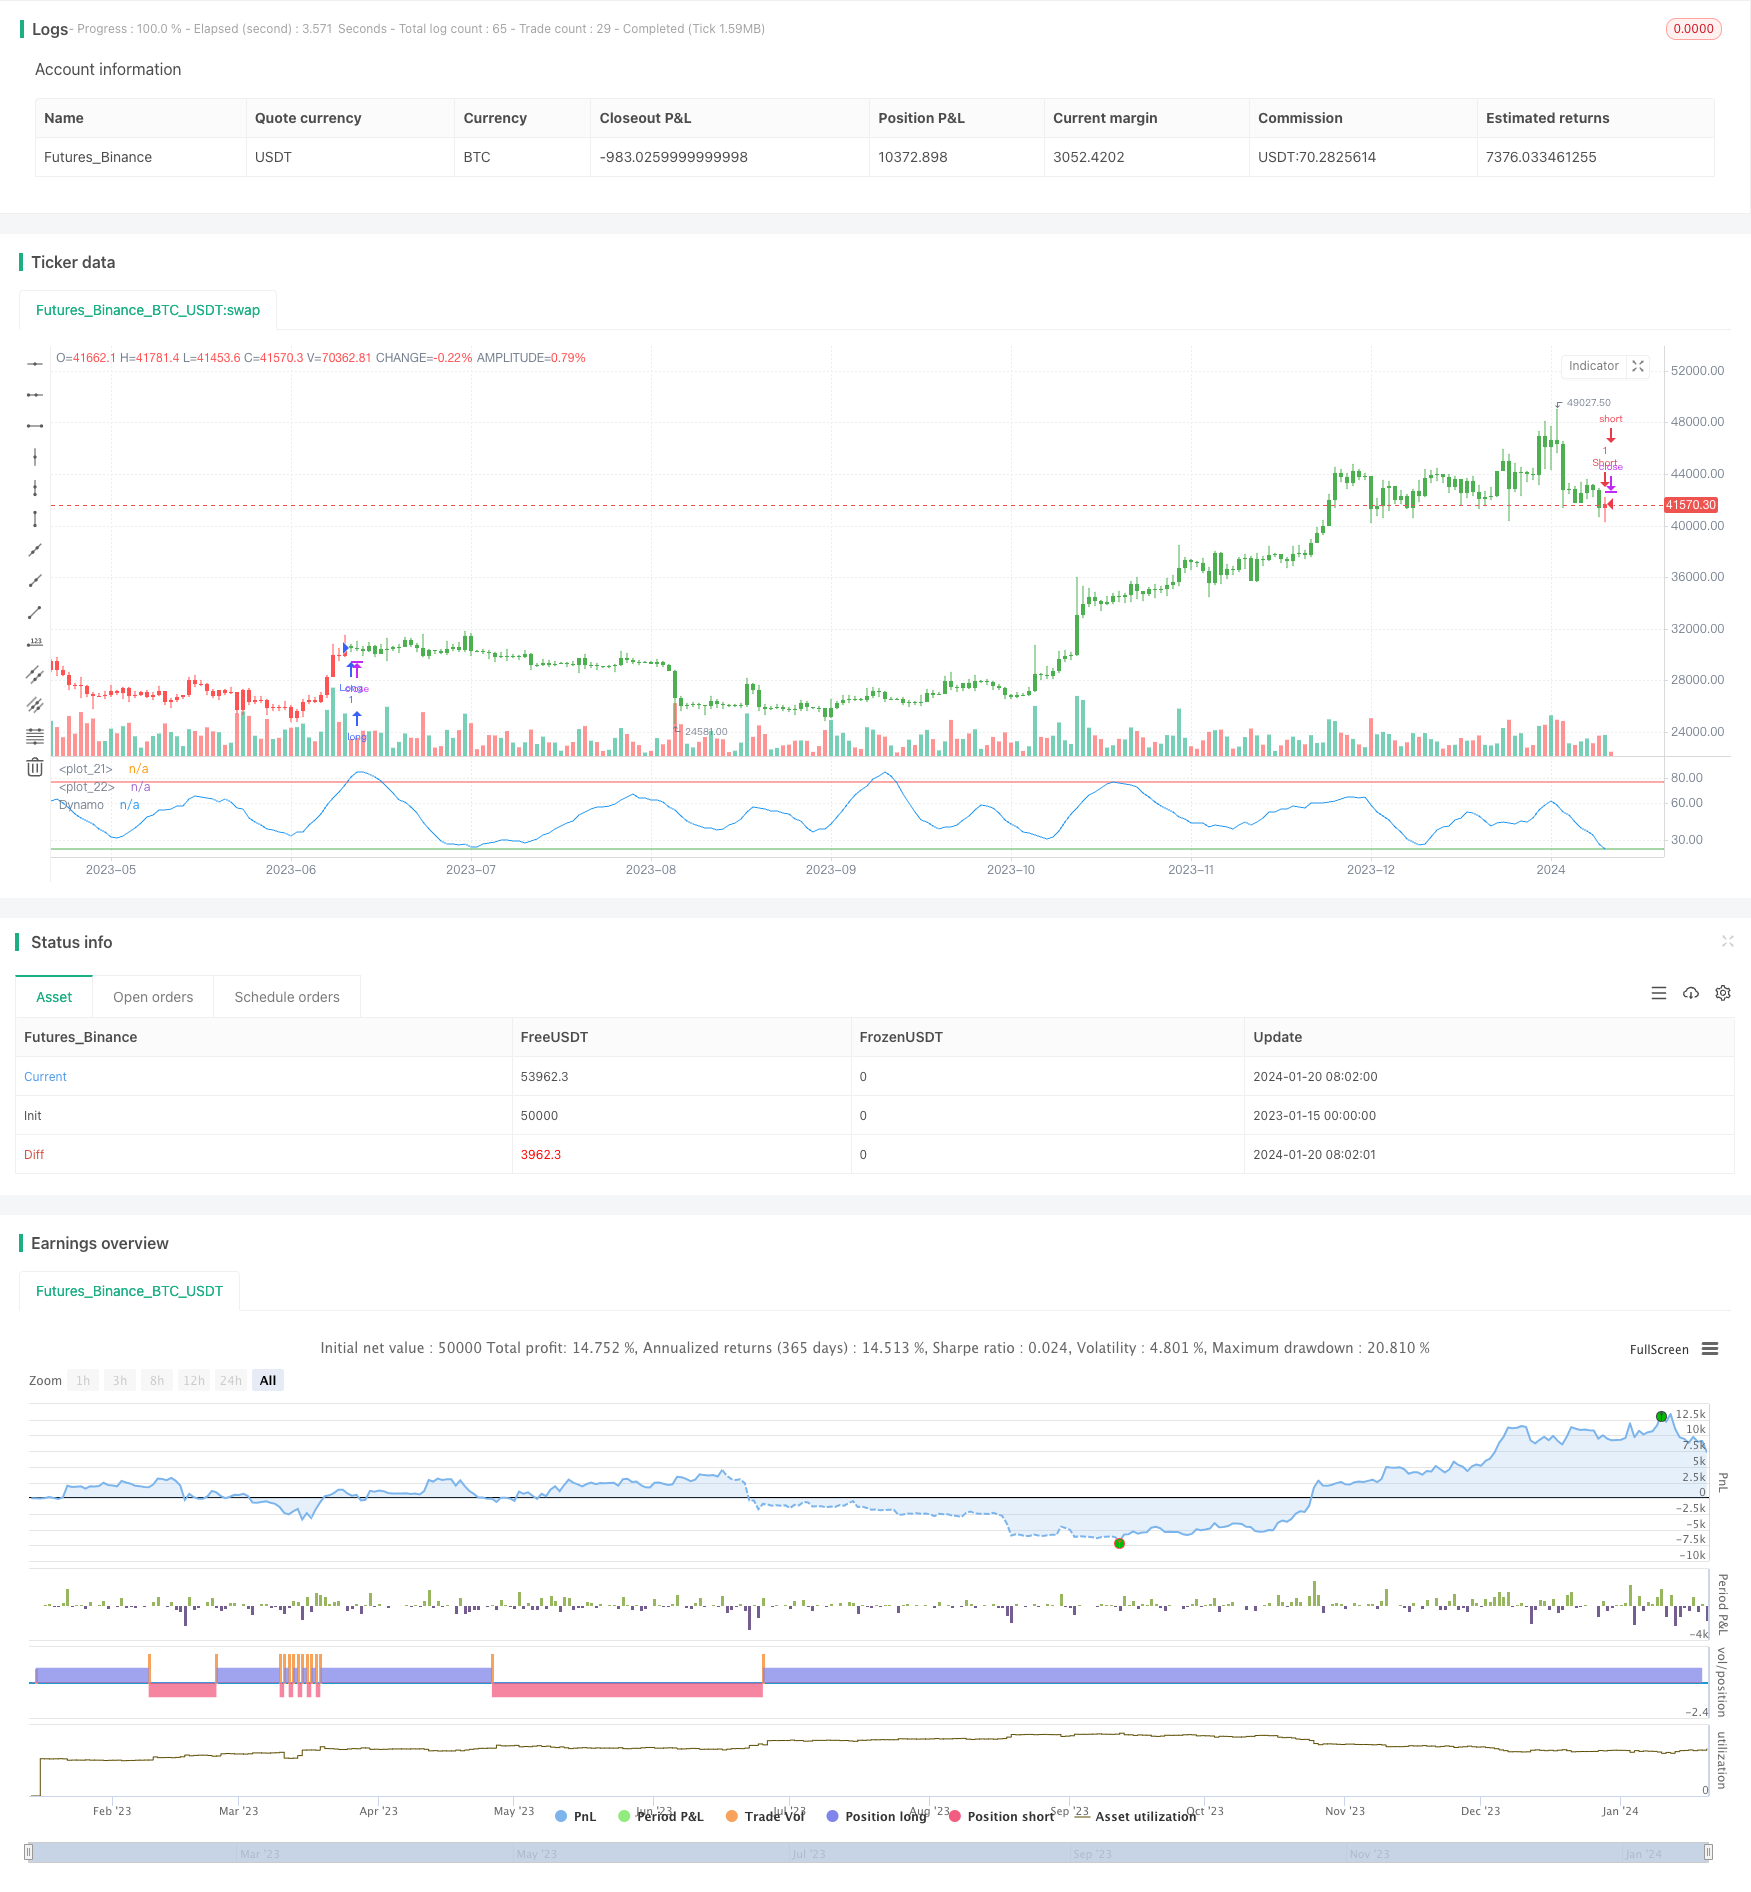
该策略首先计算一个长度为10日的随机指数(Stochastic Oscillator),然后计算该指数的10日简单移动平均,再基于这个移动平均计算20日移动平均。这组成了动态动量震荡器的计算基础。
Strategy接着计算了指数的最高值和最低值,然后计算中间值。它将20日均线与原指数做差,再从中间值中减去这个差值,形成标准化后的震荡器值。当这个标准化值高于77时做多,低于23时做空。
优势分析
该策略的主要优势有:
利用动态动量震荡器指标消除了趋势的影响,使得交易信号更加可靠。
结合超买超卖区域,可以在反转点产生较准确的交易信号。
规则简单清晰,容易实施。
风险分析
该策略的主要风险有:
市场暴震时,指标发出错误信号的概率会较大。可以设置止损来控制风险。
震荡市场中,会频繁产生假信号。可以适当调整参数,过滤掉一些噪音。
交易频率可能较高,交易成本会对盈利产生一定影响。
优化方向
该策略可以从以下几个方面进行优化:
测试不同市场的数据,寻找最佳合约和最优参数组合。
增加过滤条件,在发出信号前判断趋势力度,避免在震荡行情中被套。
增加止损机制。当价格向不利方向突破某个阈值时,选择止损退出。
可以基于该策略,开发出更复杂的交易系统,结合多个其他指标进行决策。
总结
动态动量震荡器交易策略通过消除趋势影响,在超买超卖区域发出较准确的交易信号。该策略简单易行,容易实施,但也存在一定风险。通过参数和规则优化,可以进一步改善系统稳定性和盈利能力。
策略源码
/*backtest
start: 2023-01-15 00:00:00
end: 2024-01-21 00:00:00
period: 1d
basePeriod: 1h
exchanges: [{"eid":"Futures_Binance","currency":"BTC_USDT"}]
*/

//@version=2
////////////////////////////////////////////////////////////
//  Copyright by HPotter v1.0 10/04/2017
// In July 1996 Futures magazine, E. Marshall Wall introduces the
// Dynamic Momentum Oscillator (Dynamo). Please refer to this article
// for interpretation.
// The Dynamo oscillator is a normalizing function which adjusts the
// values of a standard oscillator for trendiness by taking the difference
// between the value of the oscillator and a moving average of the oscillator
// and then subtracting that value from the oscillator midpoint.
//
// You can change long to short in the Input Settings
// Please, use it only for learning or paper trading. Do not for real trading
////////////////////////////////////////////////////////////
strategy(title="Dynamo", shorttitle="Dynamo")
OscLen = input(10, minval=1)
MALen = input(20, minval=1)
HiBand = input(77, minval=1)
LowBand = input(23)
reverse = input(false, title="Trade reverse")
hline(HiBand, color=red, linestyle=line)
hline(LowBand, color=green, linestyle=line)
xOscK = stoch(close, high, low, OscLen)
xOscAvg = sma(xOscK, OscLen)
xMAVal = sma(xOscAvg, MALen)
maxNum = 9999999
LowestSoFar = iff(xOscAvg < nz(LowestSoFar[1], maxNum), xOscAvg, nz(LowestSoFar[1], maxNum))
HighestSoFar = iff(xOscAvg > nz(HighestSoFar[1]), xOscAvg, nz(HighestSoFar[1]))
MidPnt = (LowestSoFar + HighestSoFar) / 2
nRes = MidPnt - (xMAVal - xOscAvg)
pos = iff(nRes > HiBand, 1,
	     iff(nRes < LowBand, -1, nz(pos[1], 0)))
possig = iff(reverse and pos == 1, -1,
          iff(reverse and pos == -1, 1, pos))
if (possig == 1)
    strategy.entry("Long", strategy.long)
if (possig == -1)
    strategy.entry("Short", strategy.short)
barcolor(possig == -1 ? red: possig == 1 ? green : blue )
plot(nRes, color=blue, title="Dynamo")