概述
多时间轴趋势跟踪策略是一种融合多种不同移动平均线和回归线的趋势跟踪策略。该策略可以在20多种不同的趋势指标中进行选择,实现自动买入和卖出。
策略原理
该策略的核心是根据用户选择的趋势指标判断价格是否处于上升或下降趋势。策略首先计算出20多种移动平均线和回归线。这些指标包括普通移动平均线、加权移动平均线、指数移动平均线等在Pine编程语言标准库中的指标,也包含一些由Pine社区编写的自定义指标。然后,策略查询这些指标得到当前某一指标的值,并和前一个周期的值进行比较。如果当前值大于前一个值,则趋势为上升,反之,如果当前值小于前一个值,则趋势为下降。最后,策略根据趋势的方向判断是否应该建立长仓。在上升趋势中建立长仓,在下降趋势中清仓。
优势分析
该策略融合了20多种指标判断趋势,避免单一指标判断失误的可能。并且这些指标都经过了社区开发者的验证。可以利用不同参数进行调整,适用于多种市场环境。
与简单的双移动平均线策略相比,该策略只依赖单一指标判断趋势方向,可以更好地表达趋势,不会出现指标截然相反的假信号。
风险分析
该策略依赖指标判断趋势,无法判断趋势是否已经发生转折。因此会产生一定程度的滞后。这可能导致亏损或错过机会。可以通过调整指标参数减轻这一问题。
在突发事件发生后,所有趋势型策略都会产生较大亏损。需要设定止损来控制风险。
优化方向
可以考虑结合其他指标判断来预测趋势转折,以减少滞后的问题。例如结合布林带指标判断价格是否过度扩张。
可以针对突发事件设计应急止损机制。例如在单日内发生超过5%的亏损时启动强制止损。
总结
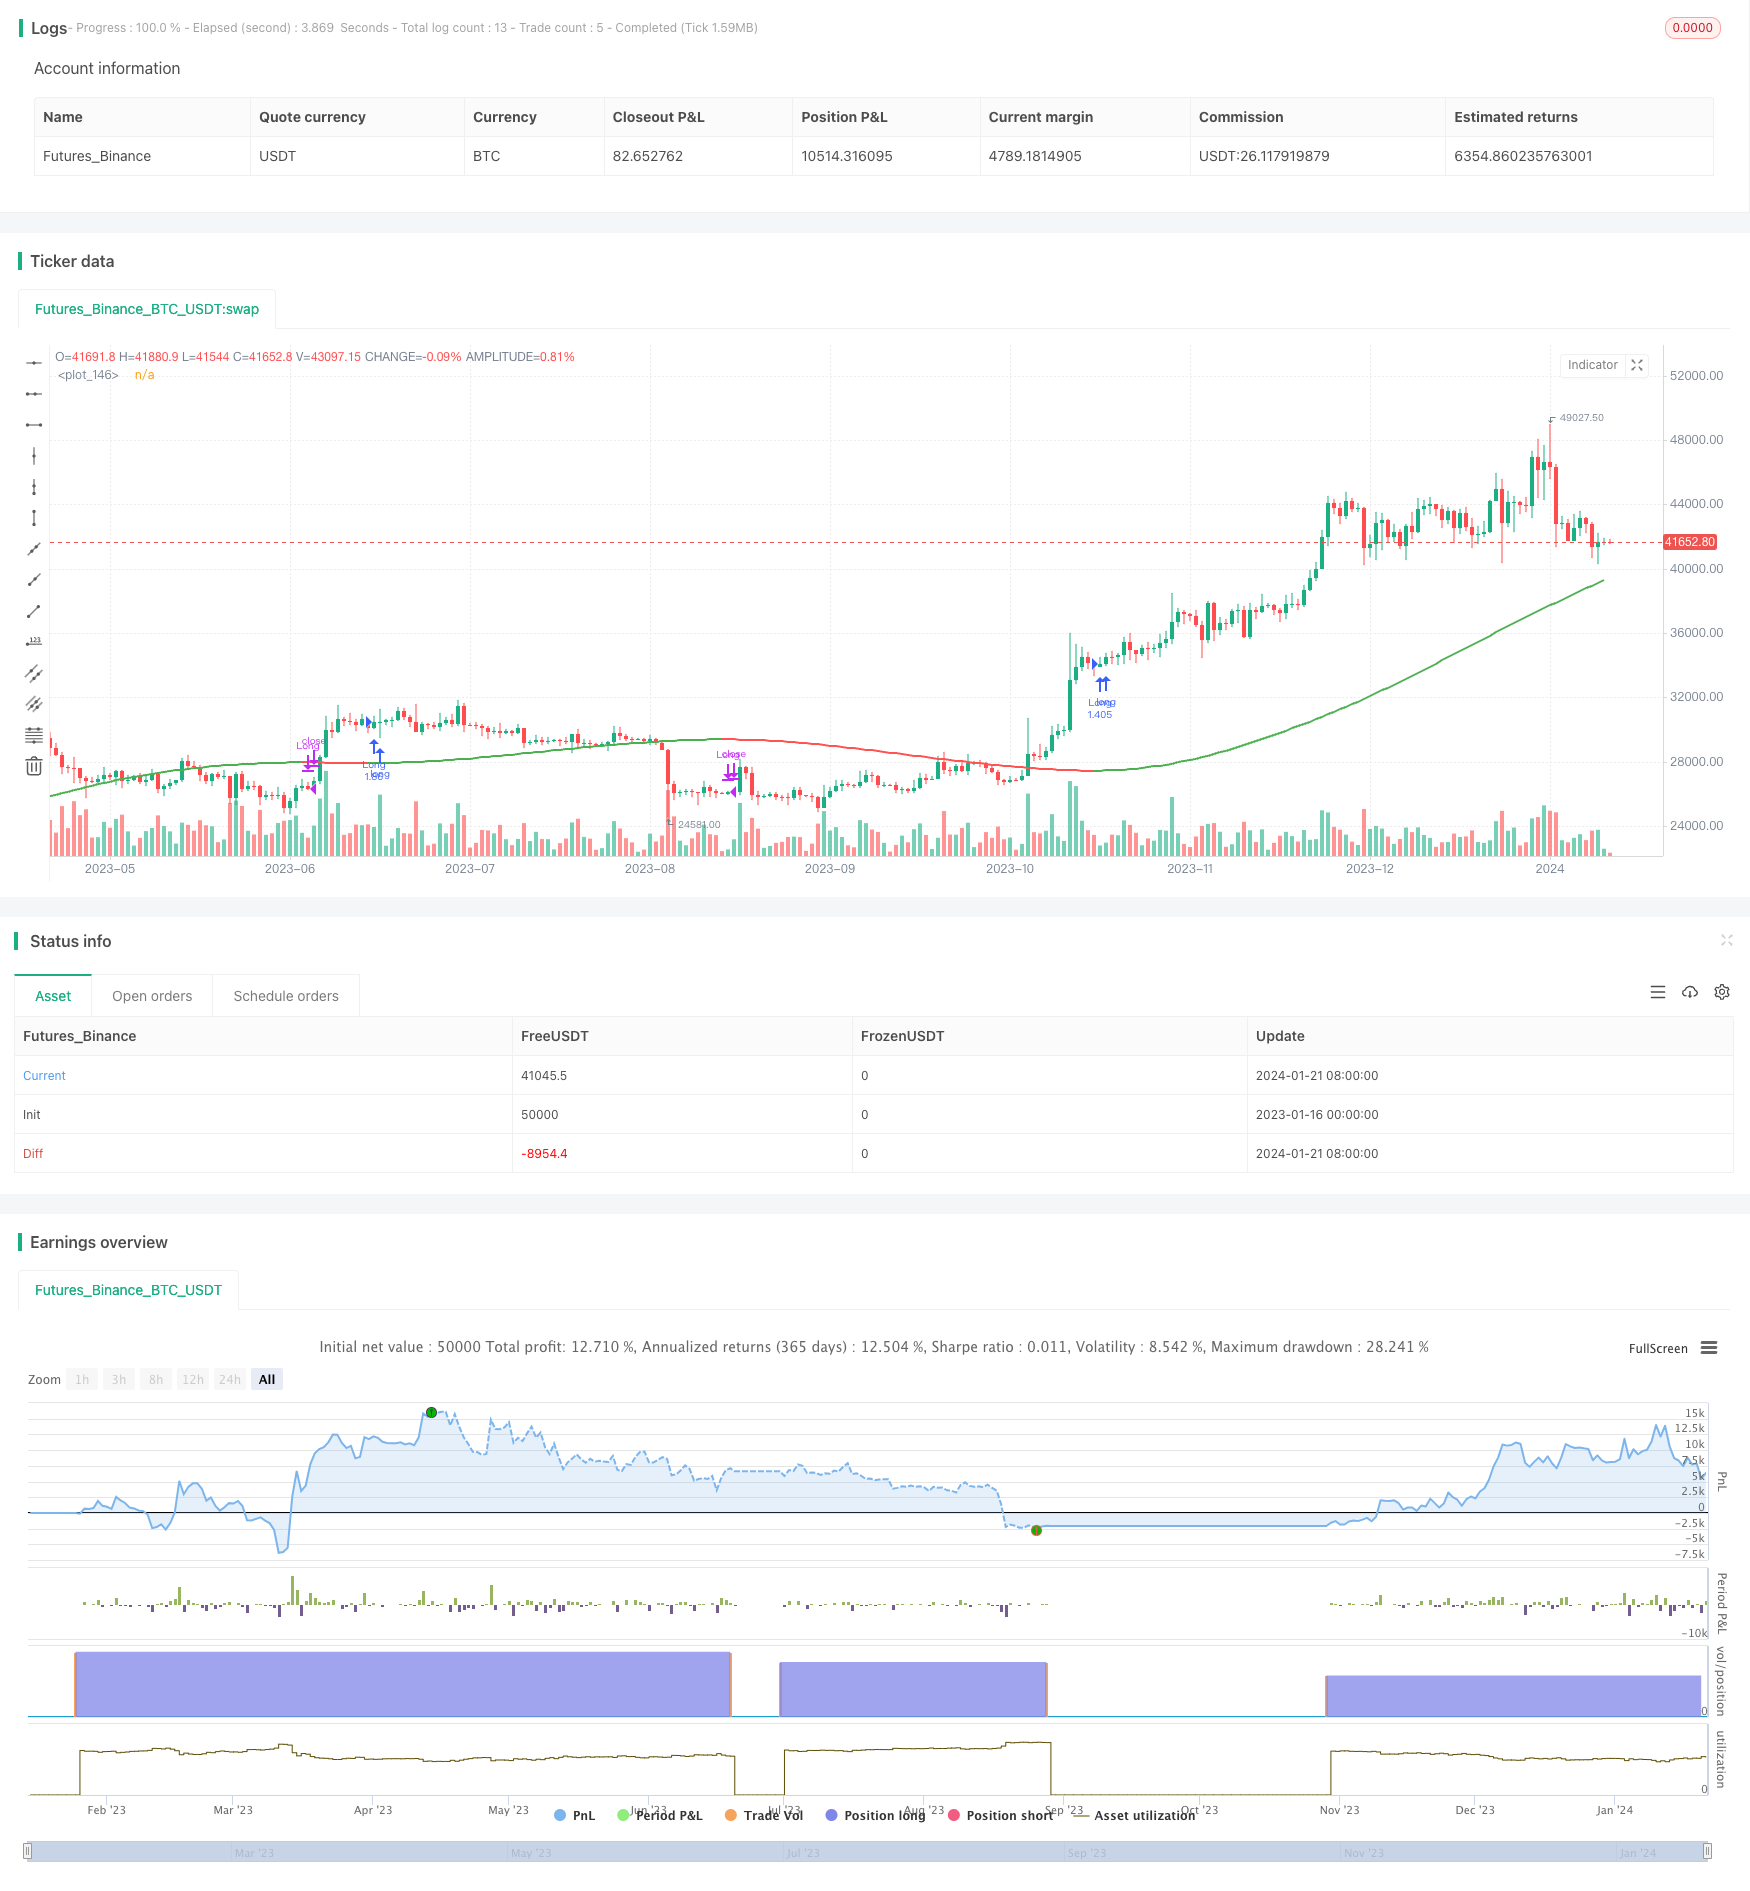
多时间轴趋势跟踪策略融合了20多种指标判断趋势,可以充分表达市场趋势,避免假信号。同时保留了很高的可定制性,可以适用于差异较大的市场环境。是一种非常有效的趋势跟踪策略。通过设定恰当的止损和优化指标参数,可以在控制风险的前提下获得较好的回报。
/*backtest
start: 2023-01-16 00:00:00
end: 2024-01-22 00:00:00
period: 1d
basePeriod: 1h
exchanges: [{"eid":"Futures_Binance","currency":"BTC_USDT"}]
*/

// This source code is subject to the terms of the Mozilla Public License 2.0 at https://mozilla.org/MPL/2.0/
// @version=5
// Author = TradeAutomation


strategy(title="Multi MA Trend Following Strategy Template", shorttitle="Multi Trend", process_orders_on_close=true, overlay=true, commission_type=strategy.commission.cash_per_order, commission_value=1, slippage = 0, margin_short = 75, margin_long = 75, initial_capital = 100000000, default_qty_type=strategy.percent_of_equity, default_qty_value=100)

// Backtest Date Range Inputs //
StartTime = input(defval=timestamp('01 Jan 2019 05:00 +0000'), group="Date Rangte", title='Start Time')
EndTime = input(defval=timestamp('01 Jan 2099 00:00 +0000'), group="Date Range", title='End Time')
InDateRange = true

// Trend Selector //
TrendSelectorInput = input.string(title="Trend Selector", defval="JMA", group="Core Settings", options=["ALMA", "DEMA", "EMA", "HMA", "JMA", "KAMA", "Linear Regression (LSMA)", "RMA", "SMA", "SMMA", "Source", "SuperTrend", "TEMA", "TMA", "VAMA", "VIDYA", "VMA", "VWMA", "WMA", "WWMA", "ZLEMA"], tooltip="Select your moving average")
src = input.source(close, "Source", group="Core Settings", tooltip="This is the price source being used for the moving averages to calculate based on")
length = input.int(200, "MA Length", group="Core Settings", tooltip="This is the amount of historical bars being used for the moving averages to calculate based on")
LineWidth = input.int(2, "Line Width", group="Core Settings", tooltip="This is the width of the line plotted that represents the selected trend")

// Individual Moving Average / Regression Setting //
AlmaOffset = input.float(0.85, "ALMA Offset", group="Individual MA Settings", tooltip="This only applies when ALMA is selected")
AlmaSigma = input.float(6, "ALMA Sigma", group="Individual MA Settings", tooltip="This only applies when ALMA is selected")
ATRFactor = input.float(3, "ATR Multiplier For SuperTrend", group="Individual MA Settings", tooltip="This only applies when SuperTrend is selected")
ATRLength = input.int(12, "ATR Length For SuperTrend", group="Individual MA Settings", tooltip="This only applies when SuperTrend is selected")
JMApower = input.int(2, "JMA Power Parameter", group="Individual MA Settings", tooltip="This only applies when JMA is selected")
KamaAlpha = input.float(3, "KAMA's Alpha", minval=1,step=0.5, group="Individual MA Settings", tooltip="This only applies when KAMA is selected")
LinRegOffset = input.int(0, "Linear Regression Offset", group="Individual MA Settings", tooltip="This only applies when Linear Regression is selected")
VAMALookback =input.int(12, "VAMA Volatility lookback", group="Individual MA Settings", tooltip="This only applies when VAMA is selected")

// Trend Indicators in Library //
ALMA = ta.alma(src, length, AlmaOffset, AlmaSigma)
EMA = ta.ema(src, length)
HMA = ta.hma(src, length)
LinReg = ta.linreg(src, length, LinRegOffset)
RMA = ta.rma(src, length)
SMA = ta.sma(src, length)
VWMA = ta.vwma(src, length)
WMA = ta.wma(src, length)

// Additional Trend Indicators Written and/or Open Sourced //
//DEMA
de1 = ta.ema(src, length)
de2 = ta.ema(de1, length)
DEMA = 2 * de1 - de2

//JMA [Capissmo]
beta = 0.45*(length-1)/(0.45*(length-1)+2)
alpha = math.pow(beta, JMApower)
L0=0.0, L1=0.0, L2=0.0, L3=0.0, JMA=0.0
L0 := (1-alpha)*src + alpha*nz(L0[1])
L1 := (src - L0[0])*(1-beta) + beta*nz(L1[1])
L2 := L0[0] + L1[0]
L3 := (L2[0] - nz(JMA[1]))*((1-alpha)*(1-alpha)) + (alpha*alpha)*nz(L3[1])
JMA := nz(JMA[1]) + L3[0]

//KAMA
var KAMA = 0.0
fastAlpha = 2.0 / (KamaAlpha + 1)
slowAlpha = 2.0 / 31
momentum = math.abs(ta.change(src, length))
volatility = math.sum(math.abs(ta.change(src)), length)
efficiencyRatio = volatility != 0 ? momentum / volatility : 0
smoothingConstant = math.pow((efficiencyRatio * (fastAlpha - slowAlpha)) + slowAlpha, 2)
KAMA := nz(KAMA[1], src) + smoothingConstant * (src - nz(KAMA[1], src))

//SMMA
var SMMA = 0.0
SMMA := na(SMMA[1]) ? ta.sma(src, length) : (SMMA[1] * (length - 1) + src) / length

//SuperTrend
ATR = ta.atr(ATRLength)
Signal = ATRFactor*ATR
var SuperTrend = 0.0
SuperTrend := if src>SuperTrend[1] and src[1]>SuperTrend[1]
    math.max(SuperTrend[1], src-Signal)
else if src<SuperTrend[1] and src[1]<SuperTrend[1]
    math.min(SuperTrend[1], src+Signal)
else if src>SuperTrend[1]
    src-Signal
else
    src+Signal

//TEMA
t1 = ta.ema(src, length)
t2 = ta.ema(t1, length)
t3 = ta.ema(t2, length)
TEMA = 3 * (t1 - t2) + t3

//TMA
TMA = ta.sma(ta.sma(src, math.ceil(length / 2)), math.floor(length / 2) + 1)

//VAMA
mid=ta.ema(src,length)
dev=src-mid
vol_up=ta.highest(dev,VAMALookback)
vol_down=ta.lowest(dev,VAMALookback)
VAMA = mid+math.avg(vol_up,vol_down)

//VIDYA [KivancOzbilgic]
var VIDYA=0.0
VMAalpha=2/(length+1)
ud1=src>src[1] ? src-src[1] : 0
dd1=src<src[1] ? src[1]-src : 0
UD=math.sum(ud1,9)
DD=math.sum(dd1,9)
CMO=nz((UD-DD)/(UD+DD))
VIDYA := na(VIDYA[1]) ? ta.sma(src, length) : nz(VMAalpha*math.abs(CMO)*src)+(1-VMAalpha*math.abs(CMO))*nz(VIDYA[1])

//VMA [LazyBear]
sc = 1/length
pdm = math.max((src - src[1]), 0)
mdm = math.max((src[1] - src), 0)
var pdmS = 0.0
var mdmS = 0.0
pdmS := ((1 - sc)*nz(pdmS[1]) + sc*pdm)
mdmS := ((1 - sc)*nz(mdmS[1]) + sc*mdm)
s = pdmS + mdmS
pdi = pdmS/s
mdi = mdmS/s
var pdiS = 0.0
var mdiS = 0.0
pdiS := ((1 - sc)*nz(pdiS[1]) + sc*pdi)
mdiS := ((1 - sc)*nz(mdiS[1]) + sc*mdi)
d = math.abs(pdiS - mdiS)
s1 = pdiS + mdiS
var iS = 0.0
iS := ((1 - sc)*nz(iS[1]) + sc*d/s1)
hhv = ta.highest(iS, length)
llv = ta.lowest(iS, length)
d1 = hhv - llv
vi = (iS - llv)/d1
var VMA=0.0
VMA := sc*vi*src + (1 - sc*vi)*nz(VMA[1])

//WWMA
var WWMA=0.0
WWMA := (1/length)*src + (1-(1/length))*nz(WWMA[1])

//Zero Lag EMA
EMA1 = ta.ema(src,length)
EMA2 = ta.ema(EMA1,length)
Diff = EMA1 - EMA2
ZLEMA = EMA1 + Diff

// Trend Mapping and Plotting //
Trend = TrendSelectorInput == "ALMA" ? ALMA : TrendSelectorInput == "DEMA" ? DEMA : TrendSelectorInput == "EMA" ? EMA : TrendSelectorInput == "HMA" ? HMA : TrendSelectorInput == "JMA" ? JMA : TrendSelectorInput == "KAMA" ? KAMA : TrendSelectorInput == "Linear Regression (LSMA)" ? LinReg : TrendSelectorInput == "RMA" ? RMA : TrendSelectorInput == "SMA" ? SMA : TrendSelectorInput == "SMMA" ? SMMA : TrendSelectorInput == "Source" ? src : TrendSelectorInput == "SuperTrend" ? SuperTrend : TrendSelectorInput == "TEMA" ? TEMA : TrendSelectorInput == "TMA" ? TMA : TrendSelectorInput == "VAMA" ? VAMA : TrendSelectorInput == "VIDYA" ? VIDYA : TrendSelectorInput == "VMA" ? VMA : TrendSelectorInput == "VWMA" ? VWMA : TrendSelectorInput == "WMA" ? WMA : TrendSelectorInput == "WWMA" ? WWMA : TrendSelectorInput == "ZLEMA" ? ZLEMA : SMA
plot(Trend, color=(Trend>Trend[1]) ? color.green : (Trend<Trend[1]) ? color.red : (Trend==Trend[1]) ? color.gray : color.black, linewidth=LineWidth)

// Entry & Exit Functions //

if (InDateRange)
    strategy.entry("Long", strategy.long, when = ta.crossover(Trend, Trend[1]))
    strategy.close("Long", when = ta.crossunder(Trend, Trend[1]))
if (not InDateRange)
    strategy.close_all()