概述
双均线黄金交叉算法通过计算快线和慢线的交叉情况来判断买卖时机。其中快线采用8天指数移动平均线,慢线采用最近8天的最低价的指数移动平均线。当快线从下方上穿慢线时生成买入信号;当快线从上方下穿慢线时生成卖出信号。
策略原理
该策略的核心原理是:快线代表最近价格变化趋势,慢线代表最近较低价格水平。当快线上穿慢线时,表示价格开始上升,超过最近较低价位,因此产生买入信号;当快线下穿慢线时,表示价格开始下降,低于最近较低价位,因此产生卖出信号。
具体来说,策略通过计算8天指数移动平均线作为快线,计算最近8天最低价的指数移动平均线作为慢线。然后计算价格与快线的差值,并判断差值的变化趋势。当差值开始变为正值时,表示价格开始上涨;当差值开始变为负值时,表示价格开始下跌。在差值上穿0时产生买入信号;差值下穿0时产生卖出信号。
优势分析
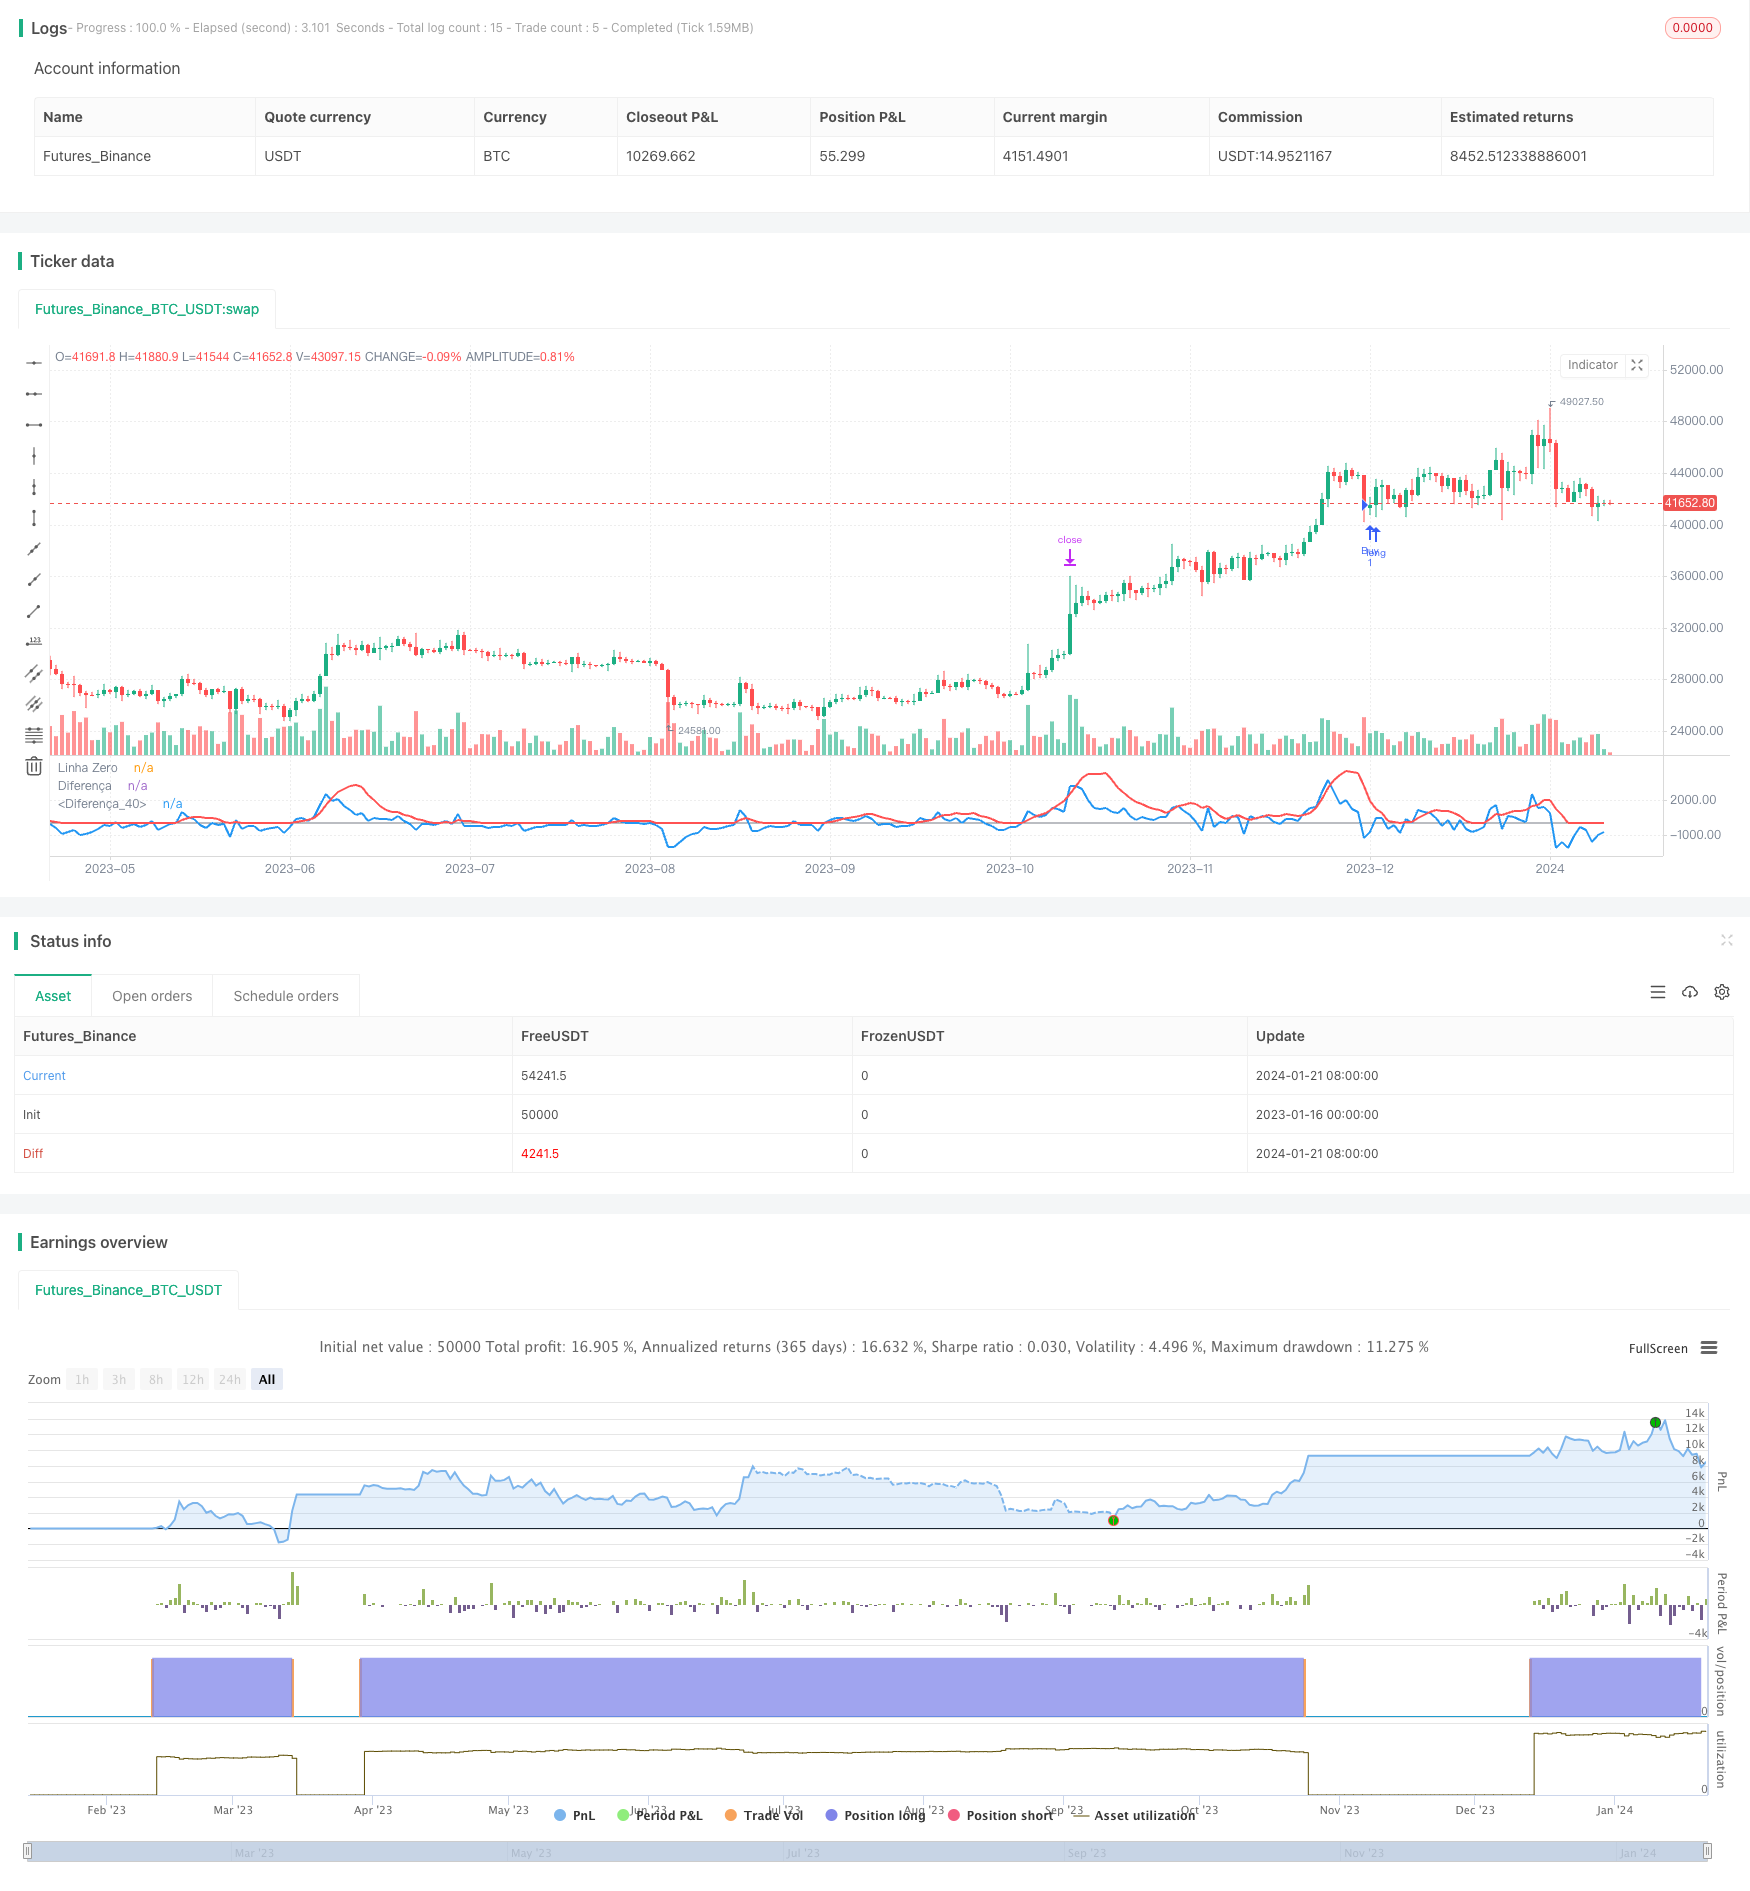
双均线黄金交叉算法最大的优势是策略思路简单清晰,容易理解和实现。通过快慢均线的交叉来判断买卖时机,是技术分析中一种较为成熟和常用的方法。该策略运用了这个成熟方法,同时进行了改进,使用快线和慢线的交叉组合来产生更可靠的交易信号。这种组合方法在避免错误信号和提高信号质量方面都有一定效果。
另外,该策略加入了止损机制。当价格上涨超过20%时,会设置该头寸的止损位为入场价的1.2倍。这可以锁定大部分利润,避免亏损。同时也确保了策略的收益率。
风险分析
双均线黄金交叉算法也存在一定的风险。该策略仅基于价格和移动平均线的关系来决定交易时机。如果价格出现异常波动而移动平均线无法及时反应,可能会产生错误的交易信号。这时需要人工检查价格行情,避免盲目跟随信号造成损失。
另外,止损机制设置为入场价的1.2倍也可能过于保守,无法持有整个行情。如果行情继续上涨,设置了止损就可能过早止损,无法获得更大收益。对此需要测试不同参数,找到更合适的止损位置。
优化方向
该策略还有进一步优化的空间。第一,可以测试不同参数,优化移动平均线的周期参数,找出生成信号质量最好的参数组合。第二,可以加入波动率指标等,避免价格震荡期生成错误信号。第三,可以使用机器学习方法自动优化止损位置。第四,可以加入同类资产之间的信息,建立组合交易系统,提高信号的可靠性。
总结
双均线黄金交叉算法整体是一个非常实用的量化交易策略。它运用均线交叉的成熟技术分析方法生成交易信号,同时进行了参数和规则的改进优化。该策略信号简单清晰,思路易于理解;有效过滤了部分噪声,提高了信号质量;并设置了止损机制控制风险。下一步通过进一步的参数优化、模型优化,该策略可以成为一个稳定可靠的程序化交易系统。
/*backtest
start: 2023-01-16 00:00:00
end: 2024-01-22 00:00:00
period: 1d
basePeriod: 1h
exchanges: [{"eid":"Futures_Binance","currency":"BTC_USDT"}]
*/

//@version=4
strategy(title = "Estratégia de Cruzamento das Linhas")

// Configuração da Média Móvel
emaPeriod = 8

ema= ema(close, emaPeriod)
ema1= ema(close[1], emaPeriod)
lowestEMA = lowest(ema, 8)

// Calcula a diferença entre o preço e a média móvel
diff = close - ema
diff1 = close[1] - ema1
diffLow = ema - lowestEMA

//Condições
diffZero = diff < 0
diffUnder = diff < diffLow
diffUm = diff > 0
Low0 = diffLow == 0


gain = strategy.position_avg_price*(1+0.2)
// Sinais de entrada
buy_signal = diffUnder and crossover(diff, diff1) and diffZero

sell_signal = diffUm and diffUnder and crossunder(diff, diff1)

// Executa as operações de compra/venda
if buy_signal
    strategy.entry("Buy", strategy.long)
if sell_signal
    strategy.exit("Buy", limit = gain)

// Plota as linhas
plot(0, title="Linha Zero", color=color.gray)
plot(diff, title="Diferença", color=color.blue, linewidth=2)

plot(diffLow, title="Diferença", color=color.red, linewidth=2)