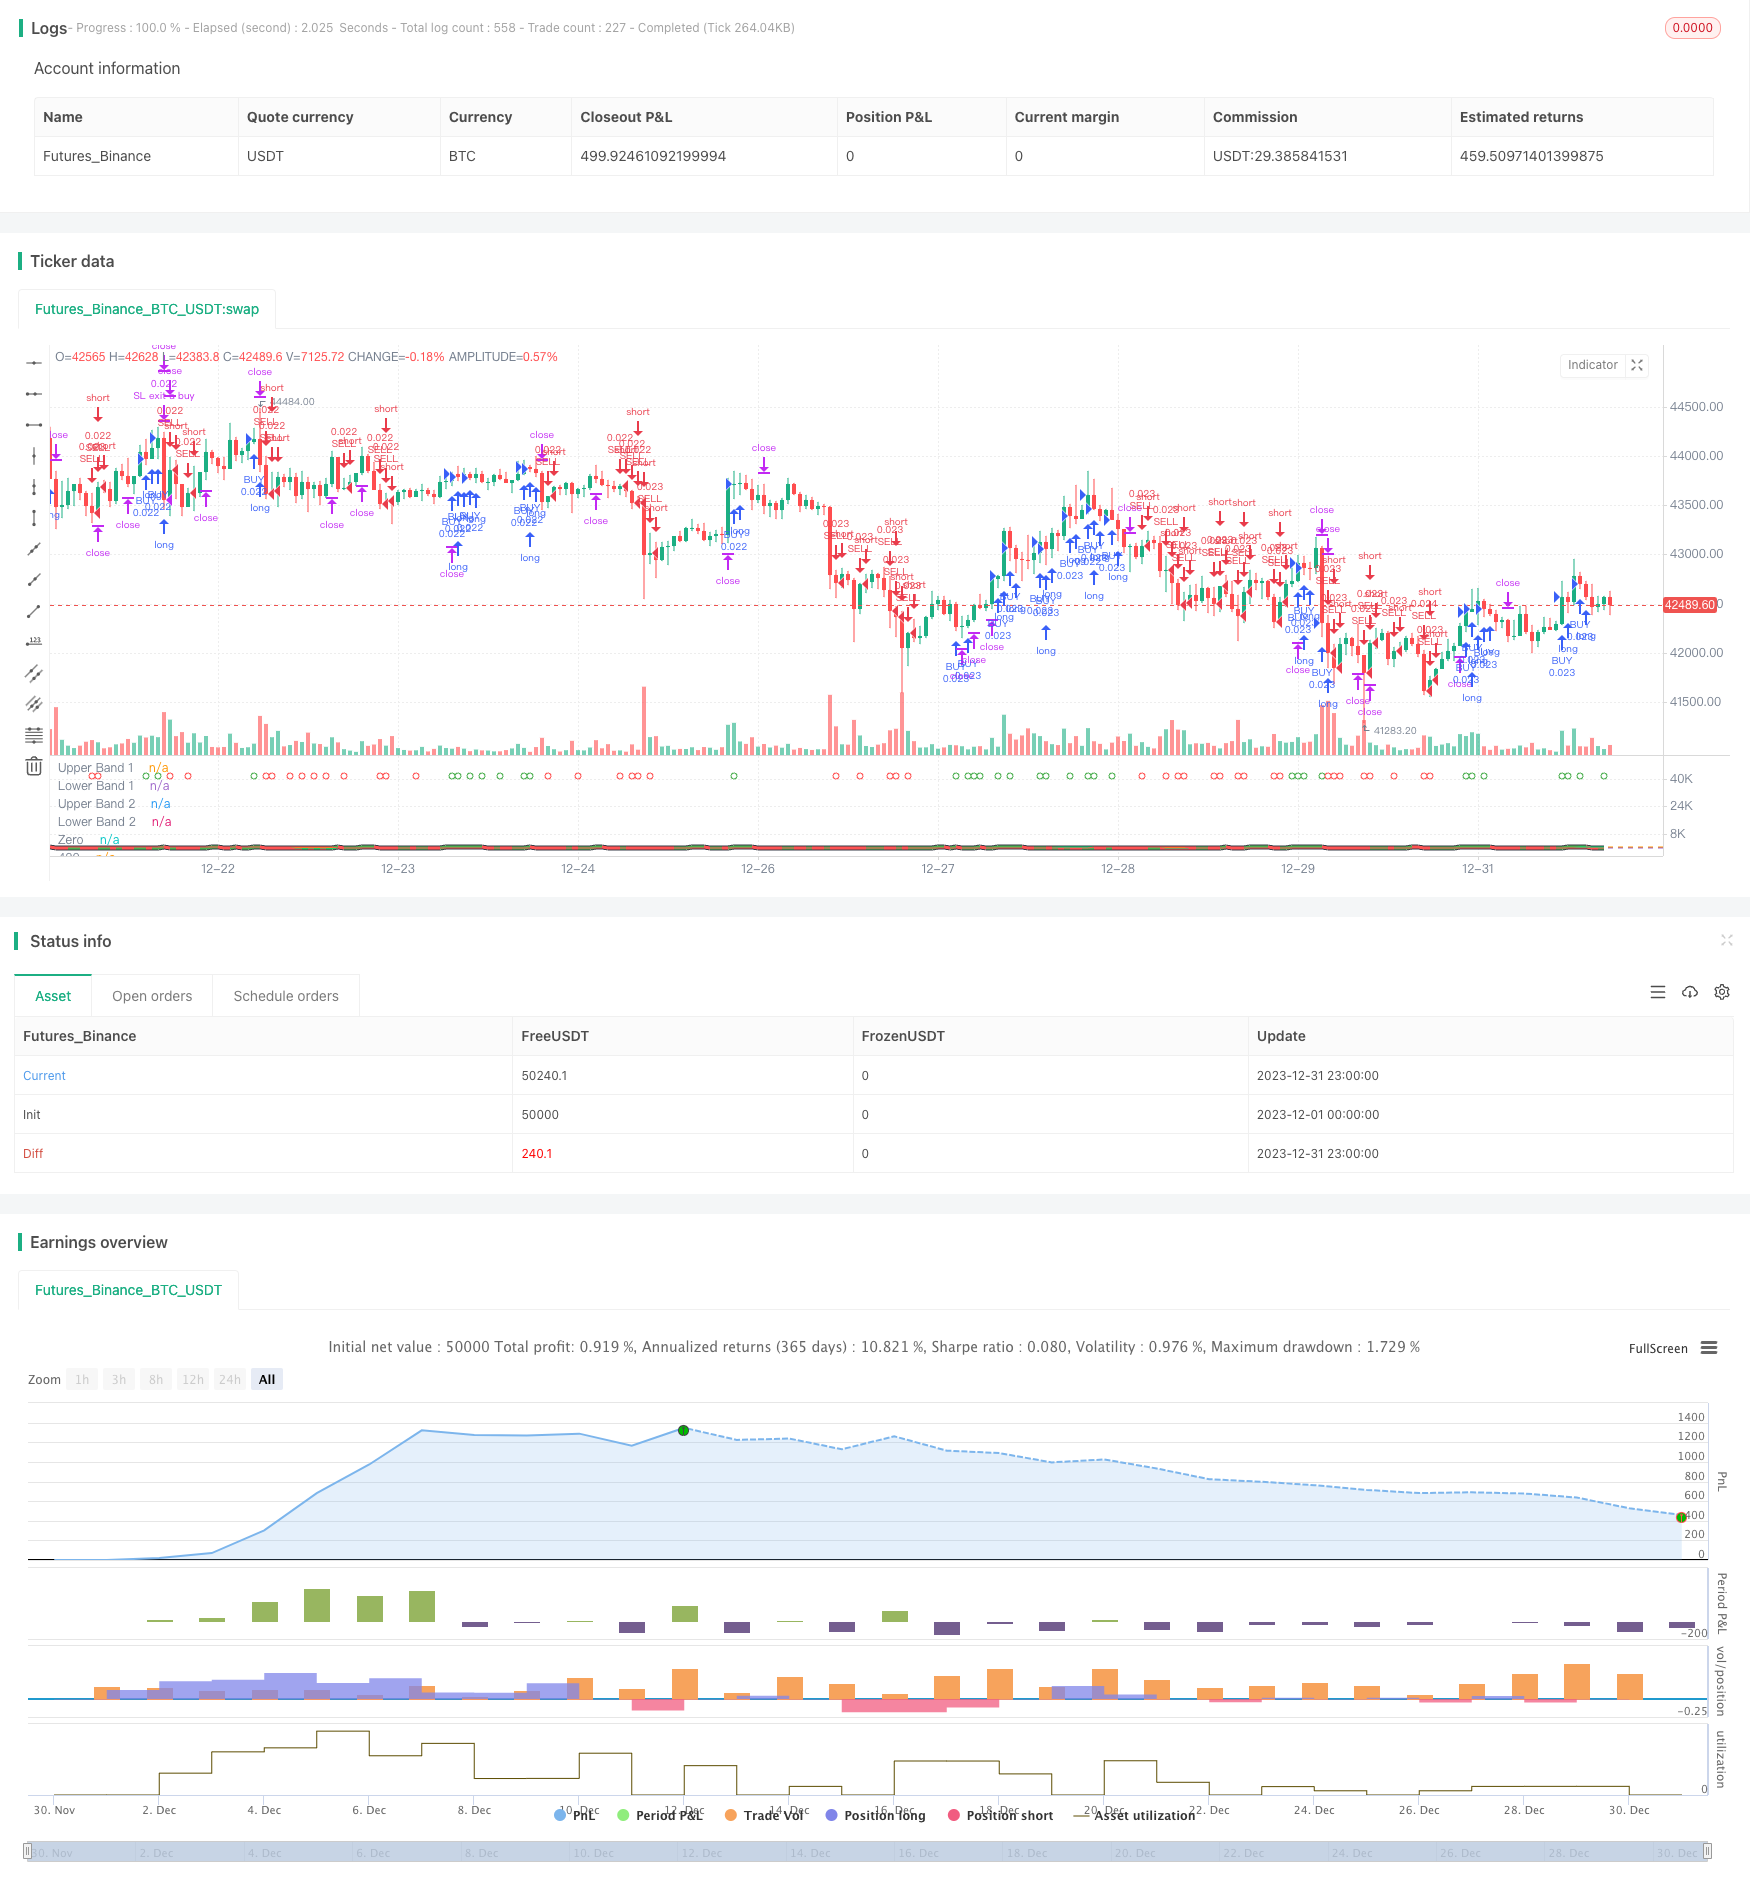
概述
本策略融合了TSI和改良CCI指标的双边交易信号,采用套利方式频繁开平仓位,目的是追求更稳定的持续盈利。关键逻辑是TSI指标的快慢均线金叉和死叉,结合HMACCI指标的多空信号线判断市场买卖方向。通过限制开仓条件来控制风险,同时设置止损和止盈逻辑。
策略原理
该策略主要基于TSI和HMACCI两个指标的结合。
TSI指标包含一个快速均线和一个慢速均线,用于判断买卖信号。当快线从下向上突破慢线时为买入信号,反之为卖出信号。这样可以较敏感地捕捉市场变化趋势。
HMACCI指标是在传统CCI指标基础上使用Hull移动平均代替价格本身,能滤波掉部分噪音,判断超买超卖区间。超买超卖区间可以再次确认TSI指标的信号方向。
策略的关键逻辑是结合这两个指标的判断结果,并设置一定的附加条件来过滤误信号,比如考察前一根K线的收盘价和多个周期前的最高价最低价,控制反转信号质量。
在开仓方面,若条件满足,每次K线收盘时就市价开仓,同时做多做空。这样可以获得更稳定的收益,但需要承担套利的风险。
在止盈止损方面,设置了浮动止损和盈利全部平仓。这可以很好地控制单边交易的风险。
策略优势
这是一个比较稳定可靠的高频套利策略。主要优势有:
- 双重指标组合,可以有效避免误信号
- 每K线开仓,频繁套利操作,盈亏波动更平稳
- 严格的开仓逻辑和止损条件,可以控制风险
- 结合趋势和反转判断,容错率较高
- 无方向偏好,适用于各类市场行情
- 参数可调整空间大,可以针对不同品种进行优化
风险分析
需要注意的主要风险有:
- 高频交易导致的更多手续费损耗
- 无法完美避免套利中被套的可能性
- 参数设置不当可能导致过于激进入场
- 短期内难以承受单边巨亏的可能性
可以通过以下方式降低风险:
- 适当调整开仓频率,降低手续费影响
- 优化指标参数,确保信号质量
- 调高止损幅度,但会承受更多套利损失
- 测试不同品种参数设置
优化方向
该策略仍有很大优化余地,主要方向是:
- 对参数如周期、长度等进行优化和测试
- 尝试不同的指标组合,如MACD、BOLL等
- 修改开仓逻辑,设置更严格的过滤条件
- 优化止盈止损策略,实现动态和突破性止损
- 尝试机器学习方法寻找更稳定的参数范围
- 对交易品种和时间段进行测试
- 结合趋势判断指标,避免震荡行情过于激进出入场
总结
该策略总体来说是一个稳定、可靠、容错率较高的双边套利策略。它融合了趋势判断和反转指标,通过频繁双边开仓获得稳定收益。同时,策略本身具有较强的可优化空间和潜力,是一种值得深入研究的高频交易思路。
策略源码
/*backtest
start: 2023-12-01 00:00:00
end: 2023-12-31 23:59:59
period: 1h
basePeriod: 15m
exchanges: [{"eid":"Futures_Binance","currency":"BTC_USDT"}]
*/

// This source code is subject to the terms of the suns bipolarity
//©SeaSide420
//@version=4
strategy(title="TSI HMA CCI", default_qty_type=strategy.cash,default_qty_value=1000,commission_type=strategy.commission.percent,commission_value=0.001)
long = input(title="TSI Long Length", type=input.integer, defval=25)
short = input(title="TSI Short Length", type=input.integer, defval=25)
signal = input(title="TSI Signal Length", type=input.integer, defval=13)
length = input(33, minval=1, title="HMACCI Length")
src = input(open, title="Price Source")
ld = input(50, minval=1, title="Line Distance")
CandlesBack = input(8,minval=1,title="Candles Look Back")
StopLoss= input(3000,minval=1, title="Stop Loss")
TargetProfitAll= input(3000,minval=1, title="Target Profit Close All")
FromMonth=input(defval=1,title="FromMonth",minval=1,maxval=12)
FromDay=input(defval=1,title="FromDay",minval=1,maxval=31)
FromYear=input(defval=2020,title="FromYear",minval=2020)
ToMonth=input(defval=1,title="ToMonth",minval=1,maxval=12)
ToDay=input(defval=1,title="ToDay",minval=1,maxval=31)
ToYear=input(defval=9999,title="ToYear",minval=2017)
start=timestamp(FromYear,FromMonth,FromDay,00,00)
finish=timestamp(ToYear,ToMonth,ToDay,23,59)
window()=>true
ul = (ld)
ll = (ld-ld*2)
ma = hma(src, length)
cci = (src - ma) / (0.015 * dev(src, length))
price = close
double_smooth(src, long, short) =>
	fist_smooth = ema(src, long)
	ema(fist_smooth, short)
pc = change(price)
double_smoothed_pc = double_smooth(pc, long, short)
double_smoothed_abs_pc = double_smooth(abs(pc), long, short)
tsi_value = 100 * (double_smoothed_pc / double_smoothed_abs_pc)*10
tsi_value2=ema(tsi_value/10, signal)*10
cc = color.white
ct = color.new(color.gray, 90)
if cci<ll or cci[1]<ll
    cc:=color.red
if cci>ul or cci[1]>ul
    cc:=color.green
if cci<ul and cci>ll
    cc:=color.new(color.yellow, 90)
ccc = color.white
if cci>ul
    ccc:=color.green
if cci<cci[1] and cci<ul and cci>ll
    ccc:=color.red
if cci<ll
    ccc:=color.red
if cci>cci[1] and cci>ll and cci<ul
    ccc:=color.green
tsiplot= plot(tsi_value, color=color.lime)
tsiplot2=plot(tsi_value2, color=color.red)
colorchange2 =tsi_value>tsi_value2?color.lime:color.orange
fill(tsiplot, tsiplot2, color=colorchange2, title="TSIBackground", transp=50)
band1 = hline(ul, "Upper Band 1", color=ct, linestyle=hline.style_dashed)
band0 = hline(ll, "Lower Band 1", color=ct, linestyle=hline.style_dashed)
fill(band1, band0, color=cc, title="MidBandBackground", transp=0)
band2 = hline(ul, "Upper Band 2", color=ct, linestyle=hline.style_dashed)
band3 = hline(ll, "Lower Band 2", color=ct, linestyle=hline.style_dashed)
cciplot2 = plot(cci, "CCIvHMA 2", color=color.black, transp=0, linewidth=5)
cciplot = plot(cci, "CCIvHMA", color=ccc, transp=0, linewidth=3)
hline(0, title="Zero")
hline(420, title="420")
hline(-420, title="-420")
fill(cciplot, cciplot2, color=ccc, title="CCIBackground", transp=0)
LongCondition=cci>cci[1] and cci>ll and src>src[CandlesBack] and tsi_value>tsi_value2
ShortCondition=cci<cci[1] and cci<ul and src<src[CandlesBack] and tsi_value<tsi_value2
plotshape(LongCondition, title="BUY", style=shape.circle, location=location.top, color=color.green)
plotshape(ShortCondition, title="SELL", style=shape.circle, location=location.top, color=color.red)
if  strategy.openprofit>TargetProfitAll
    strategy.close_all(when=window(),comment="close all profit target")
if LongCondition and strategy.openprofit>-1
    strategy.order("BUY", strategy.long,when=window())
if ShortCondition and strategy.openprofit>-1
    strategy.order("SELL", strategy.short,when=window())
strategy.exit("SL exit a sell", "SELL", loss = StopLoss,when=window())
strategy.exit("SL exit a buy", "BUY", loss = StopLoss,when=window())