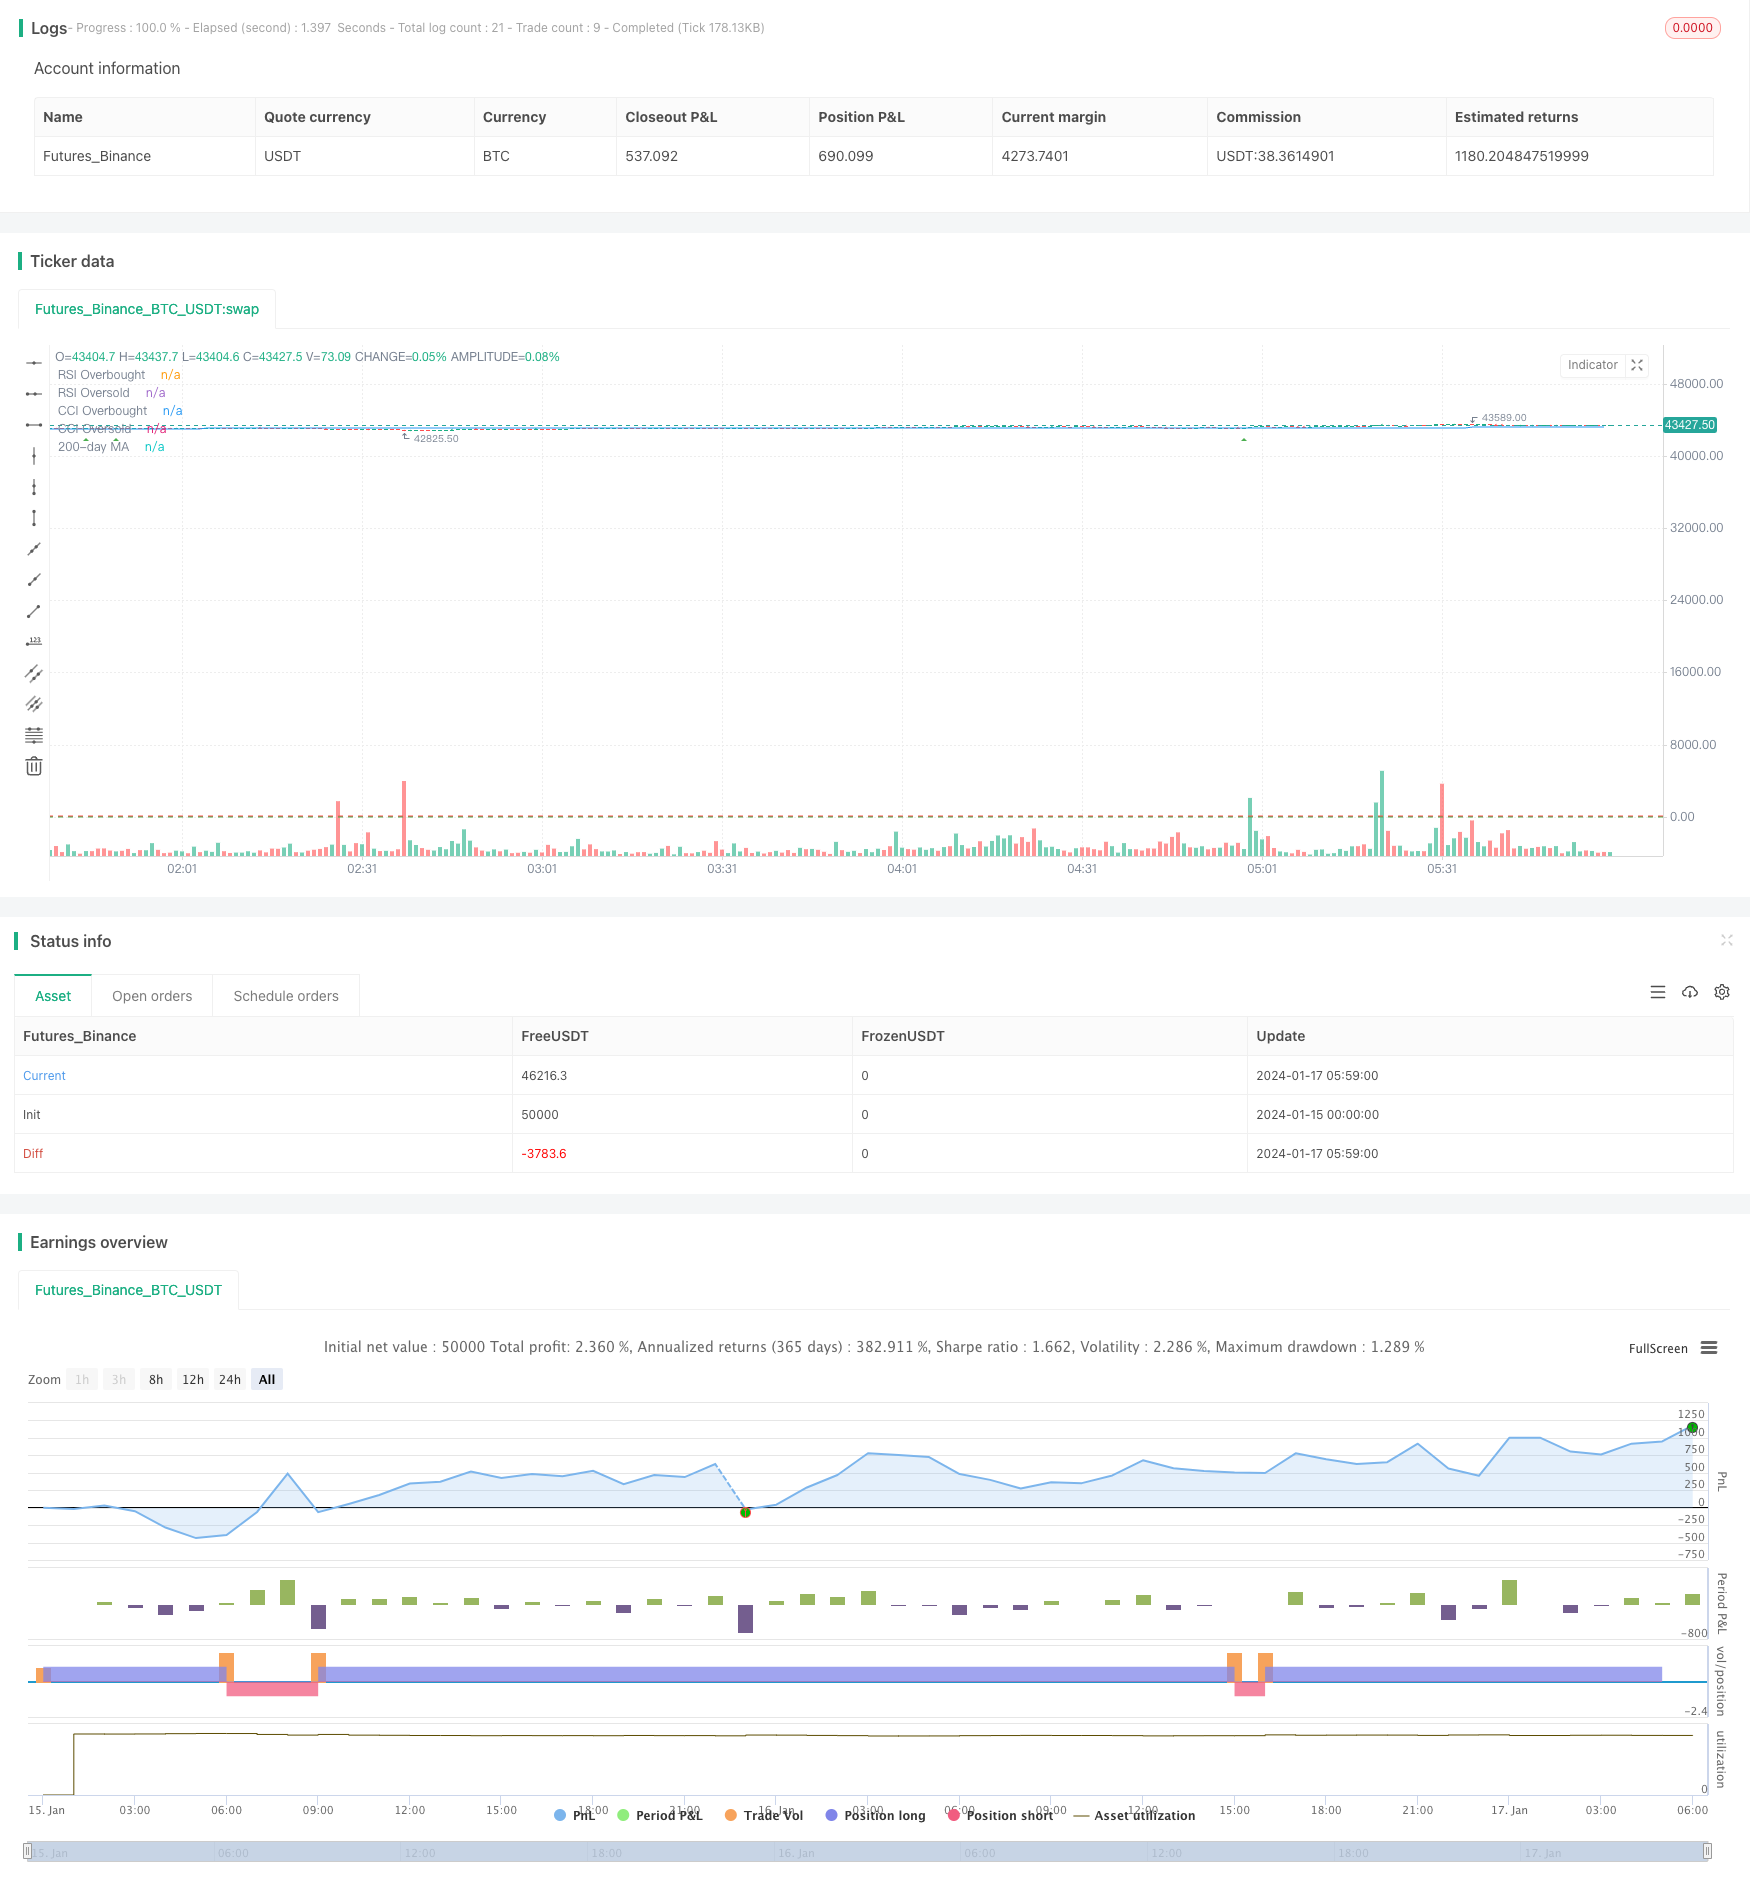
概述
该策略综合运用MACD、RSI、CCI、StochRSI和200日简单移动平均等多个指标,在日线时间帧下形成交易信号。策略首先判断MACD线和信号线金叉死叉,然后结合RSI、CCI、StochRSI指标判断是否超买超卖,最后判断价格是否突破200日移动平均线,根据这些条件筛选出买卖信号。
策略原理
该策略的核心逻辑是在MACD发出买卖信号的同时,判断其他辅助指标是否也发出类似信号,如果多数指标发出同向信号,则高概率形成有效的交易机会。
首先,MACD线和信号线发生金叉时产生买入信号,死叉时产生卖出信号。这是策略判断趋势转折的主要依据。
其次,RSI指标判断是否超买超卖。RSI高于设定的超买线时判断为超买,此时与MACD死叉配合发出卖出信号;RSI低于设定的超卖线时判断为超卖,此时与MACD金叉配合发出买入信号。
同样,CCI指标判断是否超买超卖。CCI高于设定的超买线时判断为超买,此时与MACD死叉配合发出卖出信号;CCI低于设定的超卖线时判断为超卖,此时与MACD金叉配合发出买入信号。
StochRSI指标中,K线高于D线时判断为超买,此时与MACD死叉配合发出卖出信号;K线低于D线时判断为超卖,此时与MACD金叉配合发出买入信号。
最后,价格高于200日移动平均线时,判断为上升趋势,此时与MACD金叉和其他指标配合发出买入信号;价格低于200日移动平均线时,判断为下降趋势,此时与MACD死叉和其他指标配合发出卖出信号。
通过汇总多个指标的信息,可以更准确判断市场的超买超卖状态,过滤掉一些假信号,从而制定出高概率的买卖决策。
策略优势分析
该策略综合运用多个指标作为买卖决策依据,可以有效规避误导型交易机会,提高信号的可靠性。
通过判断价格与200日移动平均线的关系,结合趋势判断买卖时机,可以减少交易风险。
RSI、CCI、StochRSI等指标参数可调节,可以针对不同市场环境进行优化,提高盈利率。
策略以日线级别操作,避免无谓的交易,更适合做长线持仓。
策略风险分析
策略信号产生有一定滞后,可能错过短期交易机会。
多个指标参与判断增加了策略复杂度,容易产生逻辑错误。
指标参数设置不当可能导致产生大量假信号。
长期持仓容易受到市场风险的影响,最大回撤可能较大。
日内短期波动可能导致亏损扩大。
策略优化方向
进行参数优化,调整RSI、CCI、StochRSI等指标的设定参数,针对不同市场环境确定最佳参数组合。
增加止损策略,通过移动止损、百分比止损等方式锁定利润,控制风险。
增加重新进入市场的技术指标或机制,避免错过重要交易机会。
结合更多的技术指标,如布林带、KD等判断买卖时机。
分析更长周期层面的趋势指标,优化策略的长线持仓能力。
总结
本策略运用MACD、RSI、CCI、StochRSI以及200日移动平均线等多个指标判断行情,在日线级别上识别买卖时机。策略优势是信号准确可靠,适合长线持仓,通过参数优化可以针对市场环境进行调整,但也存在一定的滞后性,无法锁定短期交易机会等问题。总体来说,该策略作为一个多指标判断的趋势跟踪策略还是比较可靠的,特别适用于追求长期稳定收益的投资者。
/*backtest
start: 2024-01-15 00:00:00
end: 2024-01-17 06:00:00
period: 1m
basePeriod: 1m
exchanges: [{"eid":"Futures_Binance","currency":"BTC_USDT"}]
*/

//@version=4
strategy("MACD RSI CCI StochRSI MA Strategy", shorttitle="MRCSSMA", overlay=true)

// MACD göstergesi
fastLength = input(12, title="Fast Length")
slowLength = input(26, title="Slow Length")
signalLength = input(9, title="Signal Length")
[macdLine, signalLine, _] = macd(close, fastLength, slowLength, signalLength)

// RSI göstergesi
rsiLength = input(14, title="RSI Length")
rsiLevel = input(70, title="RSI Overbought Level")
rsiValue = rsi(close, rsiLength)

// CCI göstergesi
cciLength = input(14, title="CCI Length")
cciLevel = input(100, title="CCI Overbought Level")
cciValue = cci(close, cciLength)

// Stochastic Oscillator göstergesi
stochLength = input(14, title="Stoch Length")
stochK = input(3, title="Stoch K")
stochD = input(3, title="Stoch D")
stochValue = stoch(close, high, low, stochLength)
stochDValue = sma(stochValue, stochD)

// 200 günlük hareketli ortalama
ma200 = sma(close, 200)

// Alış ve Satış Sinyalleri
buySignal = crossover(macdLine, signalLine) and rsiValue < rsiLevel and cciValue < cciLevel and stochValue > stochDValue and close > ma200
sellSignal = crossunder(macdLine, signalLine) and rsiValue > (100 - rsiLevel) and cciValue > (100 - cciLevel) and stochValue < stochDValue and close < ma200

// Ticaret stratejisi uygula
strategy.entry("Buy", strategy.long, when = buySignal)
strategy.close("Buy", when = sellSignal)
strategy.entry("Sell", strategy.short, when = sellSignal)
strategy.close("Sell", when = buySignal)

// Göstergeleri çiz
hline(rsiLevel, "RSI Overbought", color=color.red)
hline(100 - rsiLevel, "RSI Oversold", color=color.green)
hline(cciLevel, "CCI Overbought", color=color.red)
hline(100 - cciLevel, "CCI Oversold", color=color.green)

// 200 günlük hareketli ortalama çiz
plot(ma200, color=color.blue, title="200-day MA")

// Grafik üzerinde sinyal okları çiz
plotshape(series=buySignal, title="Buy Signal", color=color.green, style=shape.triangleup, location=location.belowbar, size=size.small)
plotshape(series=sellSignal, title="Sell Signal", color=color.red, style=shape.triangledown, location=location.abovebar, size=size.small)