概述
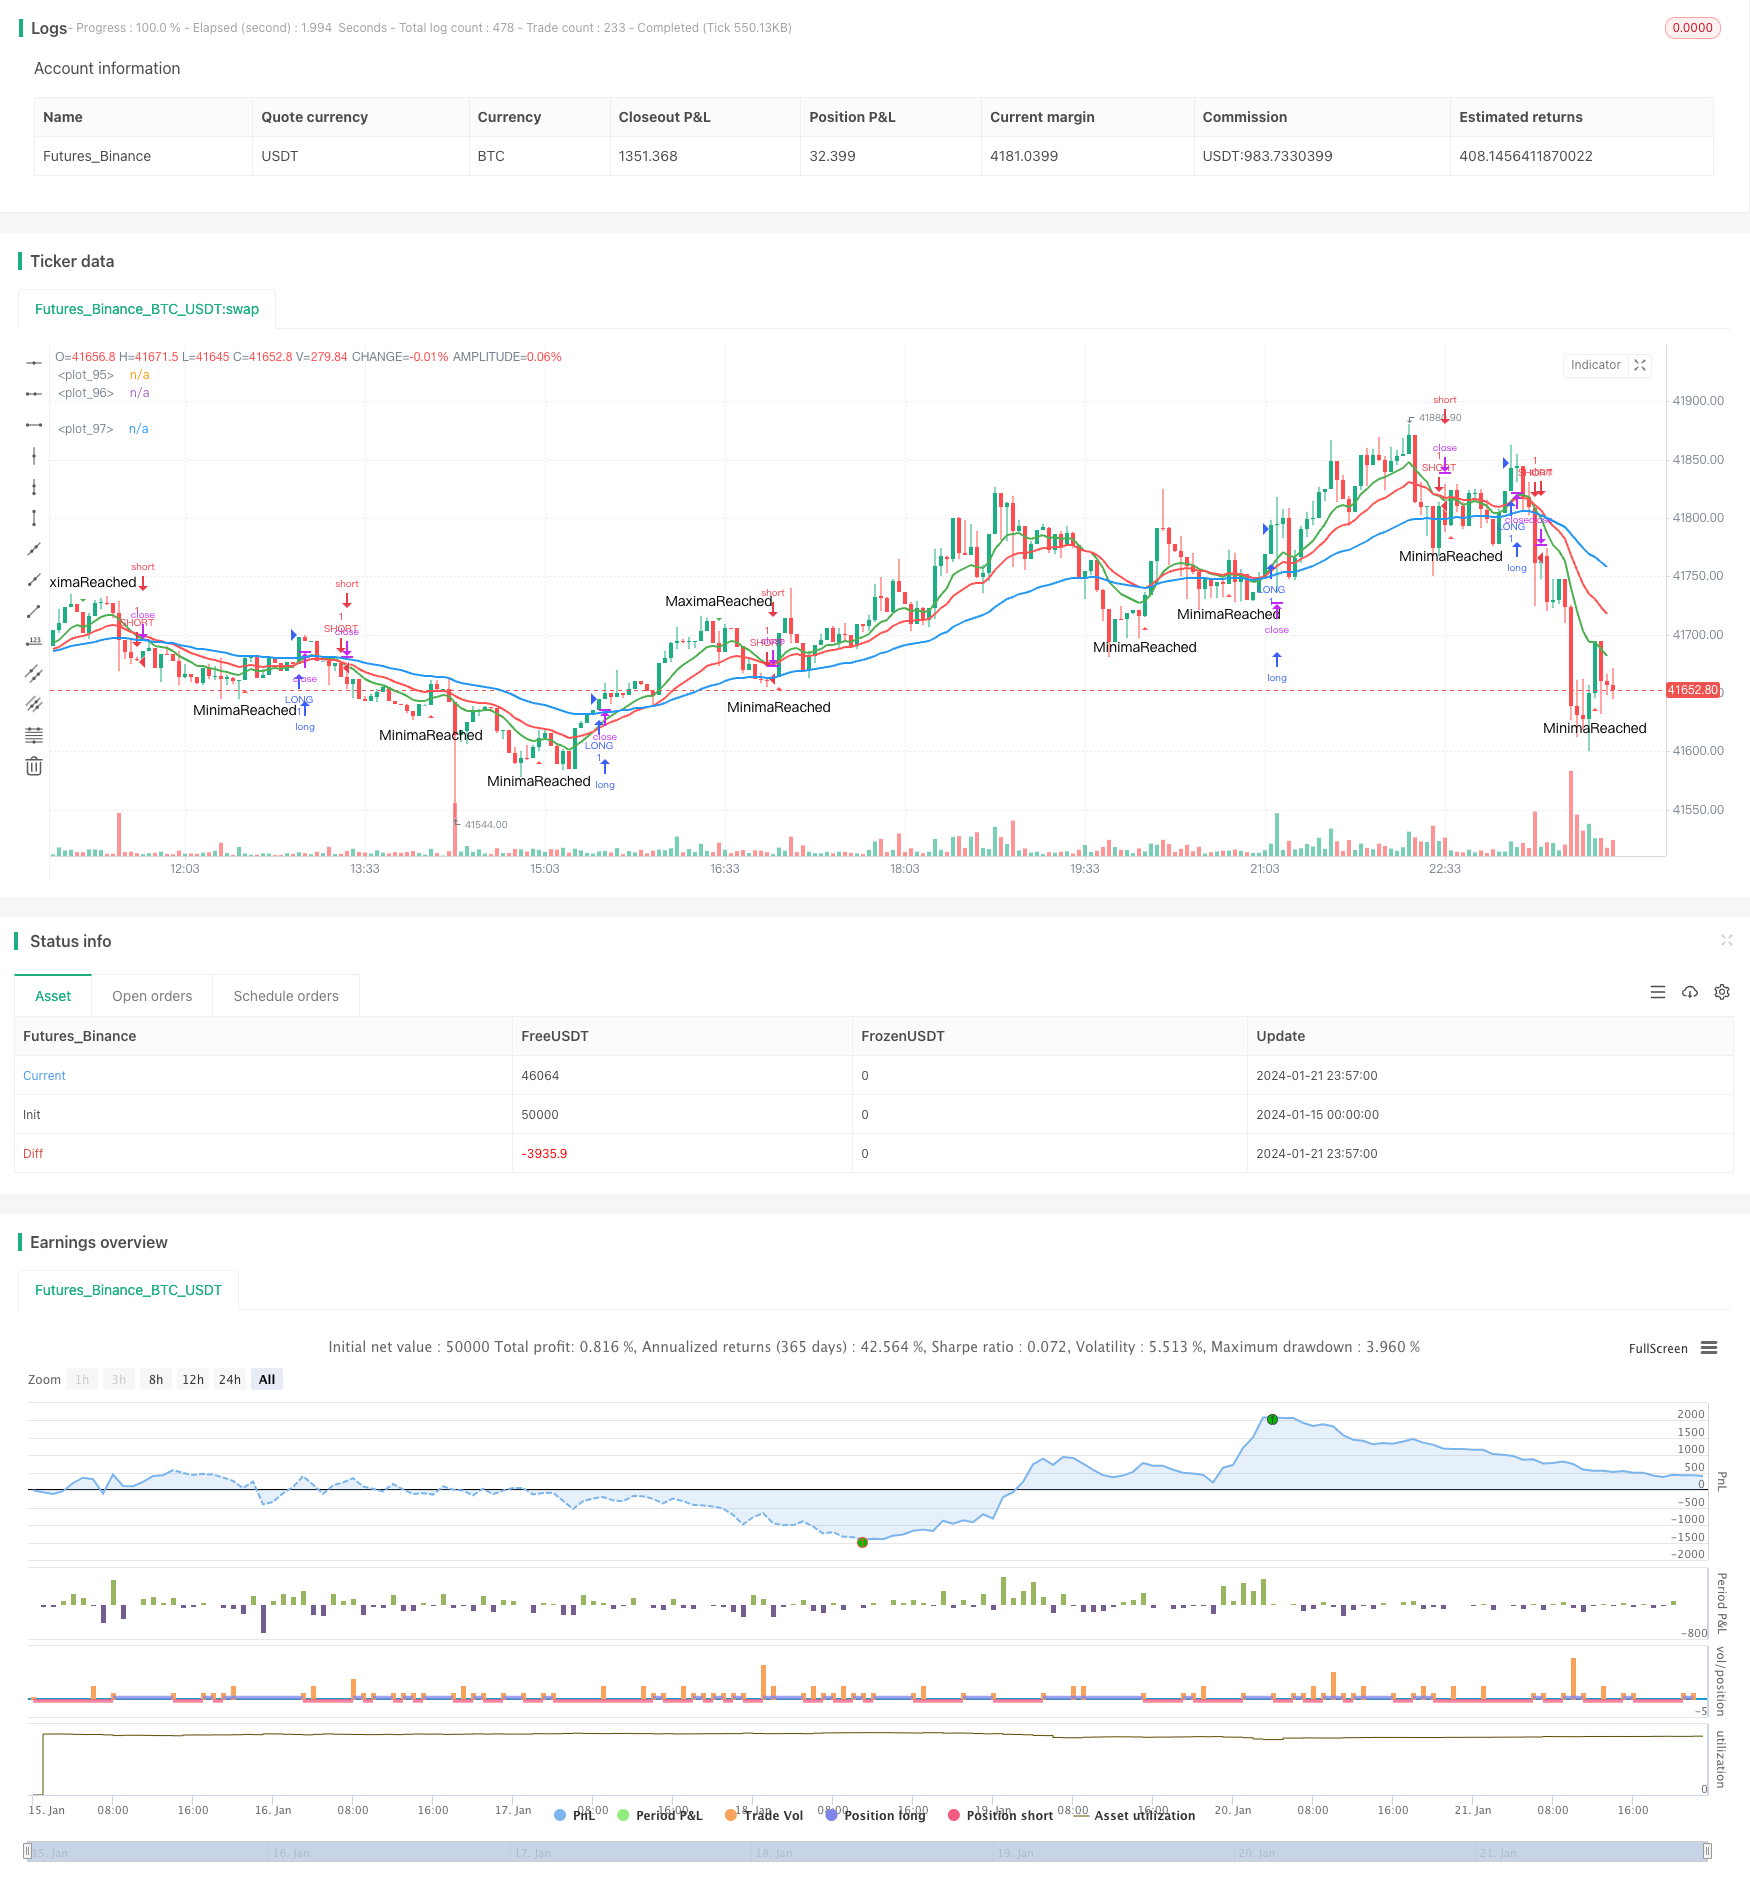
这个策略基于不同周期的EMA均线的交叉来判断趋势方向,并据此建立做多做空信号。主要使用2条均线,分别是10日线和20日线。当10日线从上向下穿过20日线时,做空;当10日线从下向上穿过20日线时,做多。该策略属于中短线交易策略。
策略原理
该策略使用了2条EMA均线,包括10日线和20日线。EMA均线能很好地反映价格的趋势方向。当短期EMA线从下向上穿过长期EMA线时,表示价格走势由跌转升,属于做多信号;当短期EMA线从上向下穿过长期EMA线时,表示价格走势由升转跌,属于做空信号。
该策略同时结合了波动的极大值和极小值来过滤一部分交易信号。只有在价格波动达到一定幅度后,才会发出交易信号。这可以一定程度上过滤掉部分假信号。
具体来说,该策略通过追踪价格的极大值和极小值的到达时间,来判断价格趋势是否形成。在极大值或者极小值达到一定时间后,才会发出真正的交易信号。
策略优势分析
该策略具有以下几个优势:
- 使用EMA均线判断趋势方向,可以有效跟踪市场走势
- 结合不同周期的EMA均线,可以在中短线上捕捉交易机会
- 通过极值过滤信号,可以过滤掉部分噪音,避免错失交易机会
- 策略逻辑简单清晰,容易理解和修改
- 可根据不同品种和交易偏好调整参数,适应性强
策略风险分析
该策略也存在一些风险:
- EMA均线本身会存在滞后性,可能错过短期价格反转
- 对噪音信号过滤不完全,可能存在一定的错误交易
- 需适当调整参数以适应不同市场环境
可以通过以下方法降低风险:
- 结合其他指标进行信号确认,避免EMA均线滞后问题
- 优化极值过滤条件,提高信号的可靠性
- 根据回测结果调整参数,优化策略
策略优化方向
该策略可以从以下几个方向进行进一步优化:
- 增加其他技术指标组合,提高交易信号准确率。例如MACD,KD等。
- 优化EMA均线的参数,使其更好适应具体品种。
- 优化极大极小值的参数,改进对价格波动的判断。
- 添加止损策略,以控制单笔交易的最大损失。
- 测试不同的品种套用该策略,评估适用性。
总结
该EMA交叉策略整体来说是一种简单实用的趋势跟踪策略。它使用EMA均线判断大趋势方向,再结合价格波动过滤信号,形成交易决策。该策略易于理解和调整参数,可以适应中短线交易。通过进一步优化,这可以成为一种值得长期持有使用的量化策略。
策略源码
/*backtest
start: 2024-01-15 00:00:00
end: 2024-01-22 00:00:00
period: 3m
basePeriod: 1m
exchanges: [{"eid":"Futures_Binance","currency":"BTC_USDT"}]
*/

//@version=2
strategy("PierceMAStrat", overlay=true)

lenMA0 = input(title="Length 0",defval=2)
lenMA1=input(title="Length 1",defval=10)
lenMA2=input(title="Length 2", defval=20)
lenMA3 = input(title = "Length3", defval =50)


emaLen0 = ema(close, lenMA0)
emaLen1 = ema(close, lenMA1)
emaLen2 = ema(close, lenMA2)
emaLen3 = ema(close, lenMA3)


ascent = if emaLen1[1] < emaLen1[0]
    true
else
    false

descent = if emaLen1[1] > emaLen1[0]
    true
else
    false

TimeSinceAscensionStart = if ascent == true
    barssince(descent == true)
else
    0


StartUp = if TimeSinceAscensionStart < 1
    true
else
    false

StartDown = if TimeSinceAscensionStart < 1
    false
else
    true


AscentBarCounter = barssince(StartUp == true)

DescentBarCounter = barssince(StartDown == true)

MaxAscent = if AscentBarCounter[1] > AscentBarCounter[0] and AscentBarCounter[1] > 10
    true
else
    false

MaxDescent = if DescentBarCounter[1] > DescentBarCounter[0] and DescentBarCounter[1] > 5
    true
else
    false

longCond = if crossover(emaLen1, emaLen2) and barssince(MaxDescent == true) > 3
    true
else
    false
shortCond = if crossunder(emaLen1, emaLen2) and barssince(MaxAscent == true) > 3
    true
else
    false


//longCond = (crossover(emaLen1, emaLen2) and (emaLen2 > emaLen3))
//shortCond = crossunder(emaLen1, emaLen2) and (emaLen2 < emaLen3)


if longCond == true
    strategy.entry("LONG", strategy.long)

if shortCond == true
    strategy.entry("SHORT", strategy.short)


plotshape(series=MaxAscent, title="MaximaReached", style=shape.triangledown, location=location.abovebar, color=green, text="MaximaReached", size=size.small)
plotshape(series=MaxDescent, title="MinimaReached", style=shape.triangleup, location=location.belowbar, color=red, text="MinimaReached", size=size.small)
//plotshape(series=StartUp, title="StartUp", style=shape.triangleup, location=location.belowbar, color=red, text="StartUp", size=size.tiny)
//plotshape(series=StartDown, title="StartDown", style=shape.triangleup, location=location.belowbar, color=green, text="StartDown", size=size.tiny)

//plotshape(series=(crossover(emaLen1, emaLen3)), title="GBXOVER", style=shape.triangleup, location=location.belowbar, color=green, text="GBXO", size=size.small)
//plotshape(series=(crossover(emaLen2, emaLen3)), title="RBXOVER", style=shape.triangledown, location=location.abovebar, color=orange, text="RBXO", size=size.small)
//plotshape(series=(crossover(emaLen1, emaLen2)), title="GRXOVER", style=shape.triangledown, location=location.abovebar, color=teal, text="GRXO", size=size.small)
//plotshape(series=(crossunder(emaLen1, emaLen2)), title="GRXUNDER", style=shape.triangledown, location=location.abovebar, color=purple, text="GRXU", size=size.small)
//plotshape(series=(crossunder(emaLen1, emaLen3)), title="GBXOVER", style=shape.triangleup, location=location.belowbar, color=yellow, text="GBXU", size=size.small)
//plotshape(series=(crossunder(emaLen2, emaLen3)), title="RBXOVER", style=shape.triangledown, location=location.abovebar, color=yellow, text="RBXU", size=size.small)

//plotshape(convergence, color=lime, style=shape.arrowup, text="CROSS")
plot(emaLen1, color=green, transp=0, linewidth=2)
plot(emaLen2, color=red, transp=30, linewidth=2)
plot(emaLen3, color=blue, transp=30, linewidth=2)