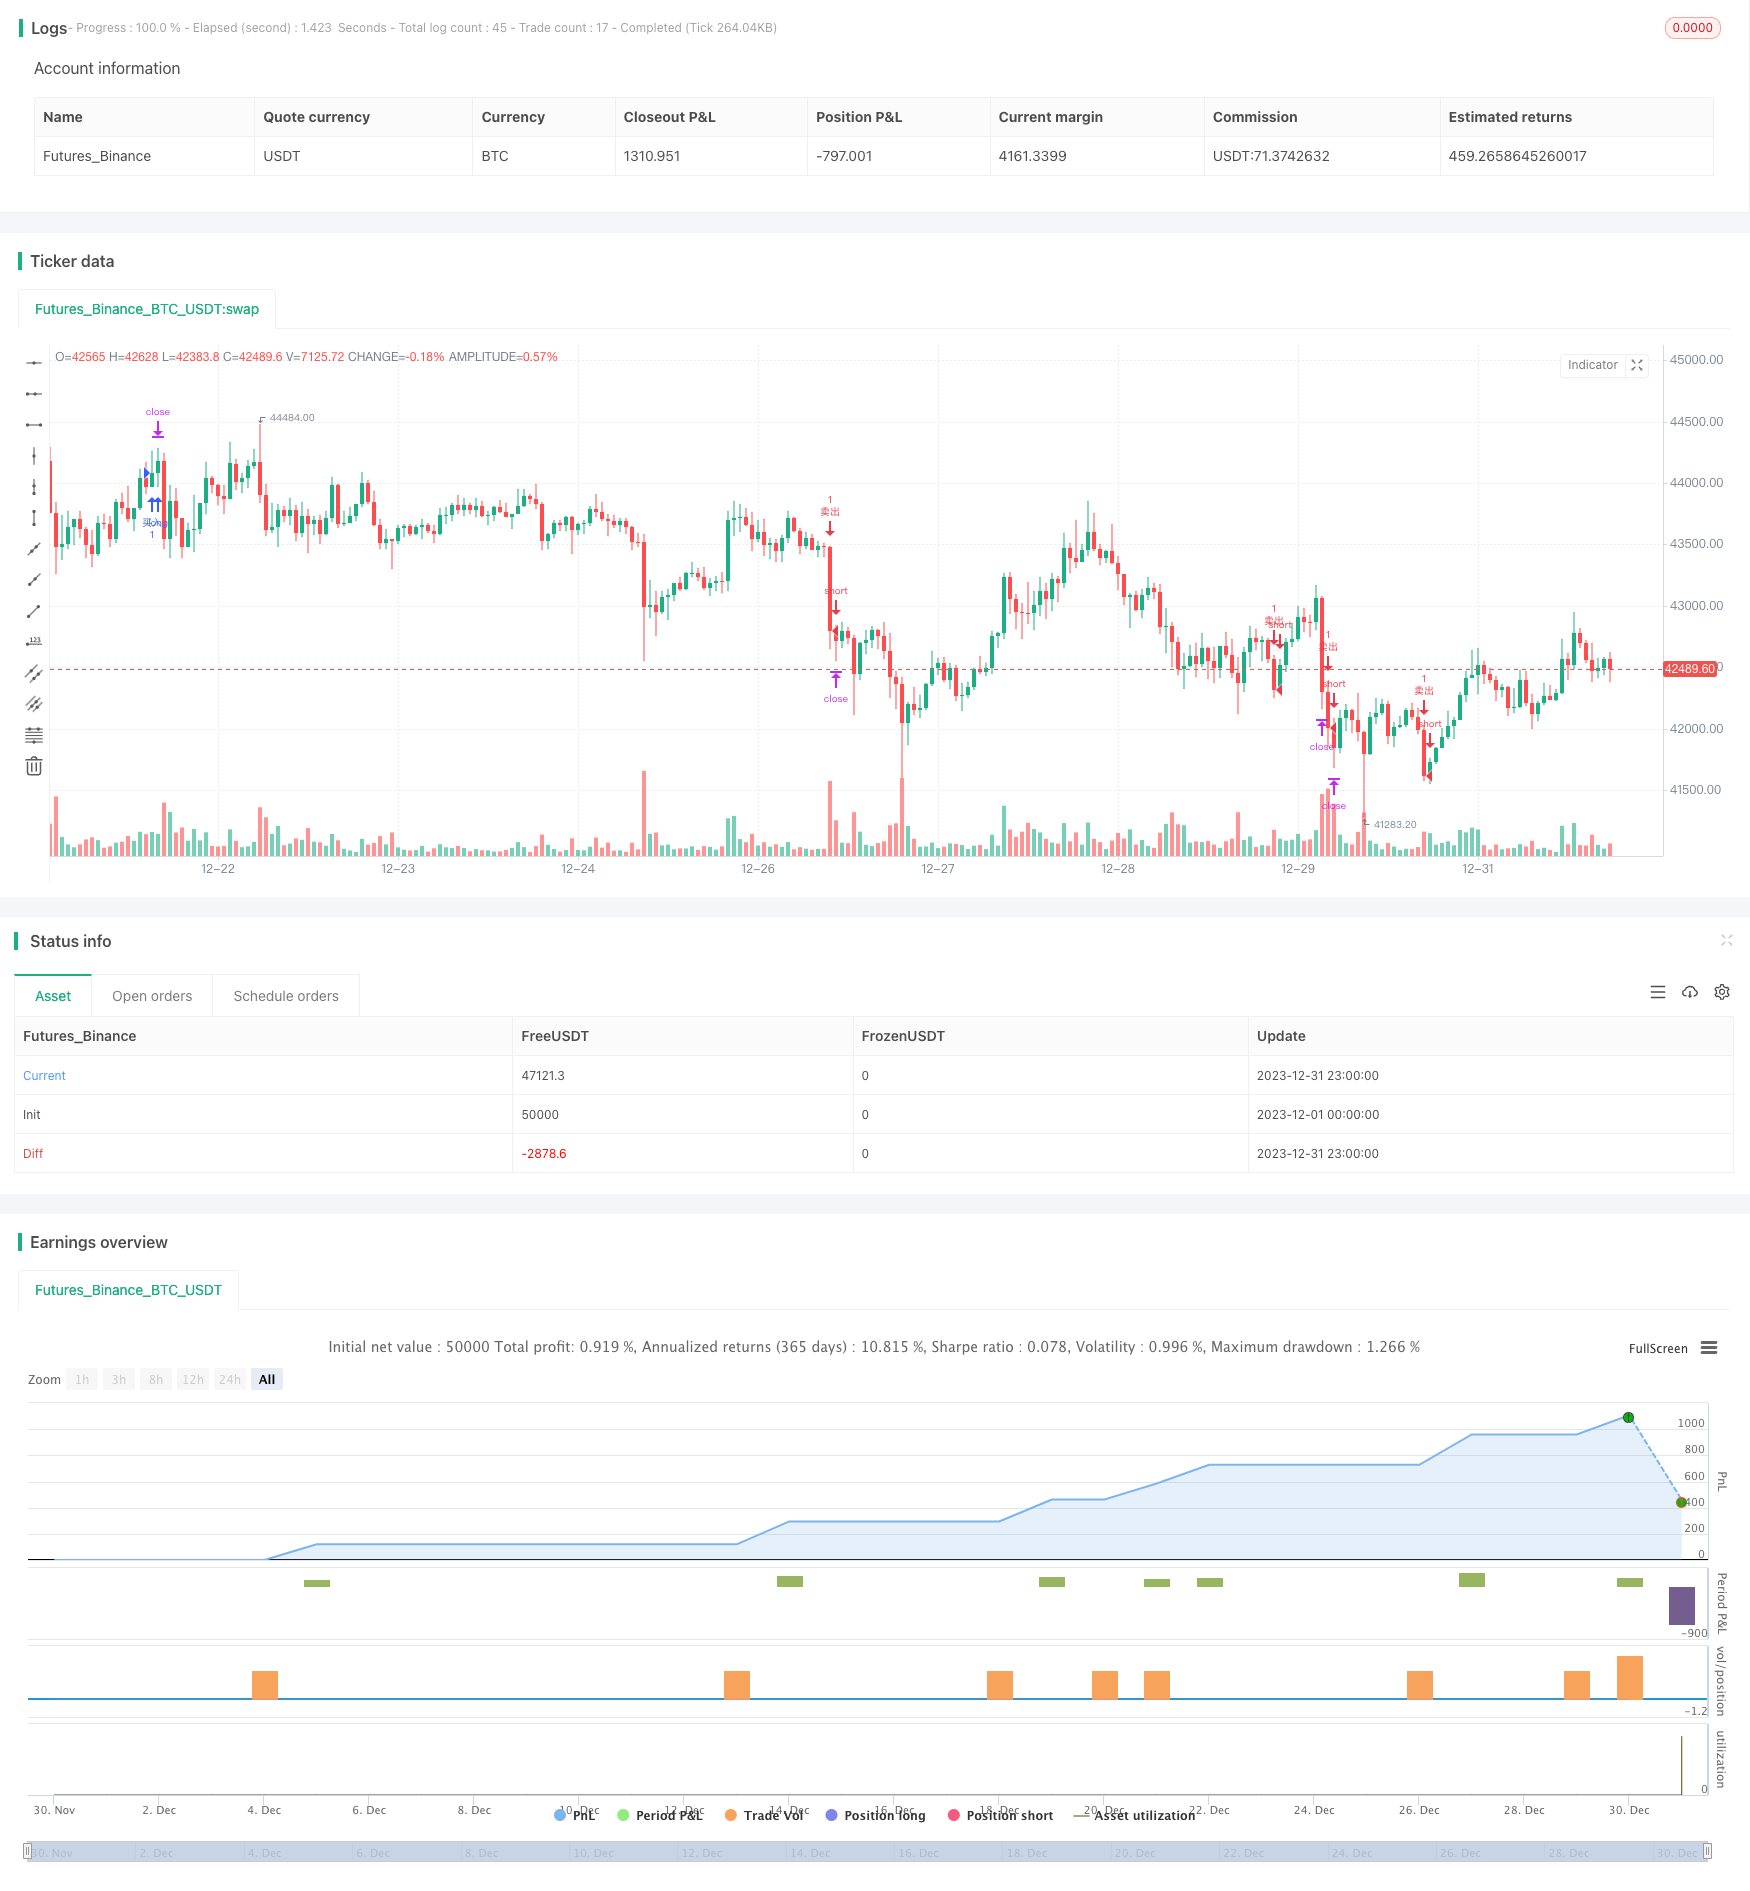
Dynamic MACD Optimization Trading Strategy

Author: ChaoZhang, Date: 2024-01-23 14:40:38
Tags:

img

Overview

This strategy optimizes the classic MACD indicator in multiple ways to generate more accurate and reliable trading signals and achieve stricter risk control. The main optimizations include: 1introducing RSI indicator to avoid overbuying/overselling; 2adding volume confirmation; 3setting stop loss and take profit; 4optimizing parameter combination.

Strategy Principle

The basic principle still uses the MACD golden cross for long and death cross for short. The main optimizations are reflected in:

  1. Introducing the RSI indicator to avoid generating false signals when the market is overestimated or underestimated. RSI can effectively reflect the buying/selling pressure in the market.

  2. Adding volume judgment, signals are only generated when the trading volume increases, avoiding invalid breakouts. The enlargement of trading volume can confirm the strength of the trend.

  3. Setting stop loss and take profit mechanisms that can dynamically track market fluctuations and control risks within bearable ranges. Stop loss can effectively limit per trade loss; take profit locks in profits and avoids profit retracement.

  4. Optimizing MACD parameter combination to obtain better parameter portfolio and generate more precise trading signals.

Advantage Analysis

This multi-optimized MACD strategy has the following significant advantages:

  1. Greatly increased signal reliability and accuracy by reducing false signals.

  2. The strict stop loss and take profit mechanism controls trading risks and locks in profits to the maximum extent.

  3. MACD parameters are optimized and more suitable for different products and time frames.

  4. Signals generated from multiple indicator combinations have higher robustness and adaptability to broader market environments.

  5. Overall capital efficiency and risk reward ratio are greatly improved.

Risk Analysis

Some risks of this strategy also need to be prevented:

  1. The optimized parameters may not be 100% suitable for all products and periods, requiring situational adjustments.

  2. The frequency of signal generation will be reduced, resulting in certain missed trade risks.

  3. Conflicting signals may appear from multiple indicators under extreme market conditions, requiring manual judgment.

  4. Automatic stop loss may stop out prematurely in fast gap scenarios, posing some risk to profits.

The counter measures are mainly manual monitoring and judgment, adjusting parameters according to market conditions when necessary, and controlling position sizing.

Optimization Directions

The strategy can be further optimized in the following aspects:

  1. Test more indicator combinations such as Bollinger Bands, KD to form a group judgment.

  2. Apply machine learning algorithms to automatically optimize parameters for higher intelligence.

  3. Introduce stricter money management strategies such as fixed fractional, Kelly formula etc.

  4. Develop automatic take profit strategies to adjust take profit points based on trends and volatility.

  5. Apply cutting edge algorithms like deep learning for more accurate predictions.

Conclusion

By multi-dimensional optimization of the original MACD indicator, this strategy solves the problems of MACD’s tendency to generate false signals and inadequate risk control. The application of multiple indicators combined with stop loss and take profit makes the signals more accurate and reliable, and the risk control is also more strict. This strategy deserves further development and application, and is a paradigm of MACD indicator enhancement.


/*backtest
start: 2023-12-01 00:00:00
end: 2023-12-31 23:59:59
period: 1h
basePeriod: 15m
exchanges: [{"eid":"Futures_Binance","currency":"BTC_USDT"}]
*/

//@version=5
strategy("优化版MACD交易策略 ", overlay=true)

// 输入参数
fastLength = input(16, "快速线周期")
slowLength = input(34, "慢速线周期")
signalSmoothing = input(10, "信号线平滑")
rsiPeriod = input(19, "RSI周期")
overboughtRsi = 70
oversoldRsi = 30
volumeAvgPeriod = input(13, "成交量平均周期")
stopLossPerc = input.float(10.5, "止损百分比", step=0.1)
takeProfitPerc = input.float(0.3, "止盈百分比", step=0.1)

// 计算指标
[macdLine, signalLine, _] = ta.macd(close, fastLength, slowLength, signalSmoothing)
rsi = ta.rsi(close, rsiPeriod)
volumeAvg = ta.sma(volume, volumeAvgPeriod)

// 交易信号
longCondition = ta.crossover(macdLine, signalLine) and macdLine > 0 and rsi < overboughtRsi and volume > volumeAvg
shortCondition = ta.crossunder(macdLine, signalLine) and macdLine < 0 and rsi > oversoldRsi and volume > volumeAvg

// 止损和止盈
longStopLossPrice = close * (1 - stopLossPerc / 100)
longTakeProfitPrice = close * (1 + takeProfitPerc / 100)
shortStopLossPrice = close * (1 + stopLossPerc / 100)
shortTakeProfitPrice = close * (1 - takeProfitPerc / 100)

// 执行交易
if longCondition
    strategy.entry("买入", strategy.long)
    strategy.exit("买入止损止盈", "买入", stop=longStopLossPrice, limit=longTakeProfitPrice)

if shortCondition
    strategy.entry("卖出", strategy.short)
    strategy.exit("卖出止损止盈", "卖出", stop=shortStopLossPrice, limit=shortTakeProfitPrice)

More