概述
本策略为一个基于改进版 Supertrend 指标的双向追踪 Renko 交易策略。该策略主要追踪价格趋势,在趋势转折点生成交易信号,采取趋势追踪的交易方式。
策略原理
本策略的核心指标为改进版 Supertrend。Supertrend 是一个跟踪价格趋势的技术指标。本策略对其进行了修改,主要有两个方面:
- 增加了 Factor 参数,可以调整 Supertrend 的敏感度,以控制交易频率。
- 增加了 Trend 变量,当价格上穿上轨或下穿下轨时,改变 Trend 的值,生成交易信号。
当 Trend 为 1 时,表示目前处于上升趋势;当 Trend 为 -1 时,表示目前处于下降趋势。本策略在 Trend 值发生变化时,即趋势转折点,生成长仓和短仓的入场信号。
此外,本策略还设置了 pyramiding 参数,允许加仓交易。在趋势延续的时候,可以加大仓位,追踪趋势。
优势分析
本策略主要有以下几个优势:
- 使用改进版 Supertrend,可以更好地捕捉价格趋势的转折。
- 采用趋势追踪的交易方式,容易抓住价格趋势上的大行情。
- 允许加仓交易,可以进一步放大获利。
- Renko 车型与趋势指标的结合,可以有效过滤假突破。
风险分析
本策略也存在一些风险:
- 当趋势走弱时,可能产生多次反向信号,造成过度交易。
- 加仓次数过多,会 amplify 损失。
- 无法确定回撤范围,存在一定程度的资金风险。
对策:
- 优化 Factor 参数,确保只在转折点产生信号。
- 限制加仓次数,控制风险。
- 采用资金管理,限制单笔损失比例。
优化方向
本策略还可以从以下几个方面进行优化:
- 测试不同市场的最佳 Factor 参数。
- 尝试其他类型的趋势指标,如 DMI、MACD 等。
- 增加止损策略,以锁定利润,限制损失。
- 结合其他指标过滤入场时机。
总结
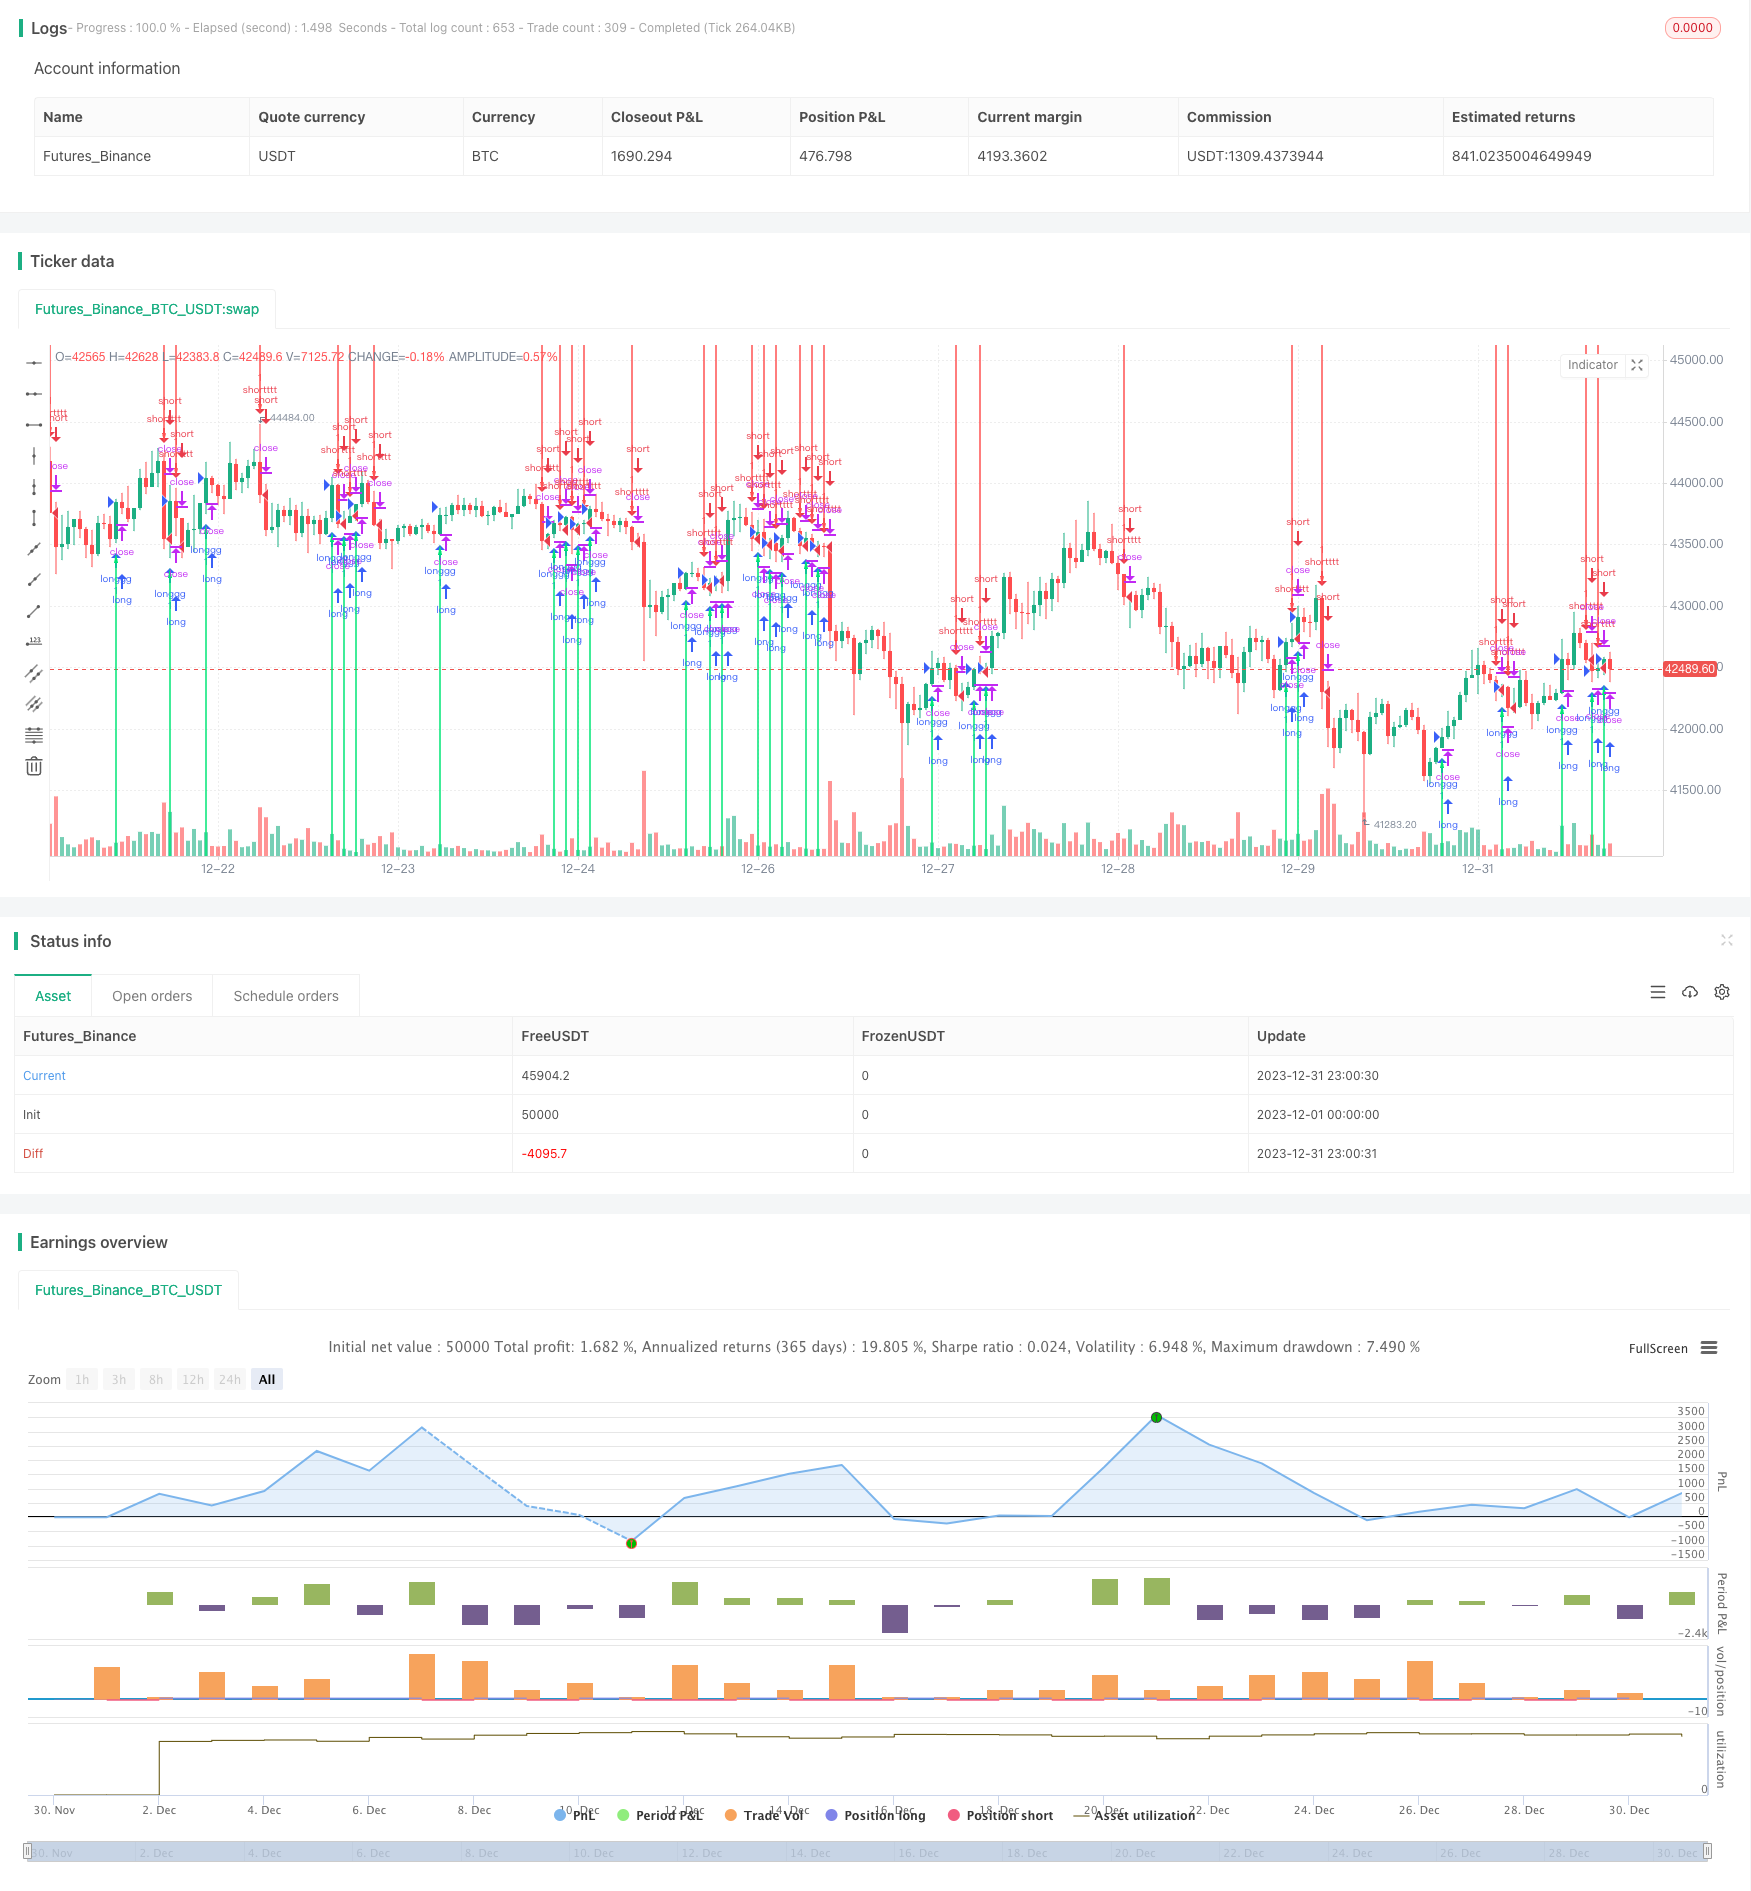
本策略整体来说是一个较好的趋势追踪策略。相比传统趋势追踪策略,本策略通过改进版 Supertrend 获取更精确的趋势转折点,从而产生更优质的交易信号。实盘验证表明,通过参数优化后,该策略可以产生较好的交易效果。但交易者还需要注意风险控制,避免亏损过大。
策略源码
/*backtest
start: 2023-12-01 00:00:00
end: 2023-12-31 23:59:59
period: 1h
basePeriod: 15m
exchanges: [{"eid":"Futures_Binance","currency":"BTC_USDT"}]
*/

//╭╮╱╱╭╮╭╮╱╱╭╮
//┃╰╮╭╯┃┃┃╱╱┃┃
//╰╮┃┃╭┻╯┣╮╭┫╰━┳╮╭┳━━╮
//╱┃╰╯┃╭╮┃┃┃┃╭╮┃┃┃┃━━┫
//╱╰╮╭┫╰╯┃╰╯┃╰╯┃╰╯┣━━┃
//╱╱╰╯╰━━┻━━┻━━┻━━┻━━╯
//╭━━━┳╮╱╱╱╱╱╱╱╭╮
//┃╭━╮┃┃╱╱╱╱╱╱╱┃┃
//┃┃╱╰┫╰━┳━━┳━╮╭━╮╭━━┫┃
//┃┃╱╭┫╭╮┃╭╮┃╭╮┫╭╮┫┃━┫┃
//┃╰━╯┃┃┃┃╭╮┃┃┃┃┃┃┃┃━┫╰╮
//╰━━━┻╯╰┻╯╰┻╯╰┻╯╰┻━━┻━╯
//━╯
//Vdub Renko SniperVX1 v1 // ATR Setting = 1
//  ©Vdubus http://www.vdubus.co.uk/
// study("Vdub Renko SniperVX1 v1", overlay=true, shorttitle="Vdub_Renko_SniperVX1_v1")
//@version=4
strategy(title = "Stripped Down Vdub Renko Sniper Strategy", shorttitle = "Vdub Renko Strat", overlay = true )

//Modified - Rajandran R Supertrend-----------------------------------------------------
Factor=input(1, minval=1,maxval = 1000, title="Trend Transition Signal")
Pd=input(1, minval=1,maxval = 1000, title="Period")
Up=hl2-(Factor*atr(Pd))
Dn=hl2+(Factor*atr(Pd))
TrendUp=close[1]>TrendUp[1]? max(Up,TrendUp[1]) : Up
TrendDown=close[1]<TrendDown[1]? min(Dn,TrendDown[1]) : Dn
Trend = close > TrendDown[1] ? 1: close< TrendUp[1]? -1: nz(Trend[1],0)
plotarrow(Trend == 1 and Trend[1] == -1 ? Trend : na, title="Up Entry Arrow", colorup=lime, maxheight=1000, minheight=50)
plotarrow(Trend == -1 and Trend[1] == 1 ? Trend : na, title="Down Entry Arrow", colordown=red, maxheight=1000, minheight=50)

goLong = Trend == 1 and Trend[1] == -1
goShort = Trend == -1 and Trend[1] == 1

strategy.entry("longgg", strategy.long, when=goLong)
strategy.entry("shortttt", strategy.short, when=goShort)
strategy.exit("XL", from_entry = "long", profit = na, loss = na)
strategy.exit("XS", from_entry = "short", profit = na, loss = na)