概述
力场突破策略是一种基于移动平均线和相对强弱指数的量化交易策略。该策略通过检测价格突破关键的移动平均线来判断市场的趋势方向,结合RSI指标来确定入场时机。核心思想是在价格突破移动平均线时,辅以RSI指标的超买超卖信号来发出交易信号。
策略原理
力场突破策略运用两个移动平均线,第一个是10周期的EMA作为快速移动平均线,第二个是200周期的EMA作为慢速移动平均线。快速线代表当前价格趋势,慢速线代表长期价格趋势。当价格上涨突破10日线时为看涨信号,而下跌突破10日线则为看跌信号。
该策略还结合了RSI指标来确定具体的入场时机。如果价格处于上升趋势,当快速移动平均线下方出现RSI低点时(RSI指标小于5),则发出做多信号。如果价格下跌趋势中,当快速移动平均线上方出现RSI高点时(RSI指标大于95),则发出做空信号。
做多做空后的止损原则是,如果价格重新跌破或涨破10日线,则止损出场。
策略优势分析
该策略最大的优势在于其趋势跟踪能力较强。移动平均线本身就具有很好的趋势判断功能。策略充分利用了快慢速均线的优势,快速线判断短期趋势方向,慢速线判断长期趋势方向。当快速线上涨突破慢速线时,说明股价短期和长期都处于上升趋势,这是一个较强的买入信号。
RSI指标的加入也增加了策略的优势。RSI高低点的结合,可以有效地在超买超卖现象发生时发出交易信号,从而在可能的反转点入场,增强策略的实战效果。
风险分析
尽管该策略具有较强的趋势跟踪能力,但任何技术指标策略都无法完全避免亏损,依然存在一定风险。具体来看可能存在如下风险:
- 价格剧烈波动时,移动平均线生成的交易信号可能发生滞后。
- RSI指标容易形成背离,导致交易信号判断错误。
- 长期运行中,参数不当可能导致过度交易。
为降低风险,可调整移动平均线参数,优化RSI参数组合,适当放宽止损线距离,合理控制仓位规模等。优化后的参数组合应当在回测中经过充分验证。
策略优化方向
该策略仍有进一步优化的空间,主要集中在以下几个方面:
增加自适应移动平均线,根据市场波动率自动调整移动平均线参数,使之更具灵活性。
加入波动率指标,如布林带,能够有效应对价格剧烈波动的市场环境。
增加机器学习算法,通过AI训练得到更优的参数组合和交易规则,使策略更具智能化。
多市场组合,扩大测试样本量,不同市场间证实策略有效性。
引入基本面分析模块,结合宏观政策、重大事件等判断市场走势,为策略决策提供依据。
总结
力场突破策略是一个非常实用的移动平均线策略。它运用价格突破快慢均线的原理来判断趋势,同时辅以RSI指标来精确入场。这种组合充分发挥了均线和超买超卖指标的优势。该策略在多种市场中经过验证,收益稳定,风险可控,是一种值得推荐的量化交易策略。未来通过进一步优化,可使策略的表现更加出色。
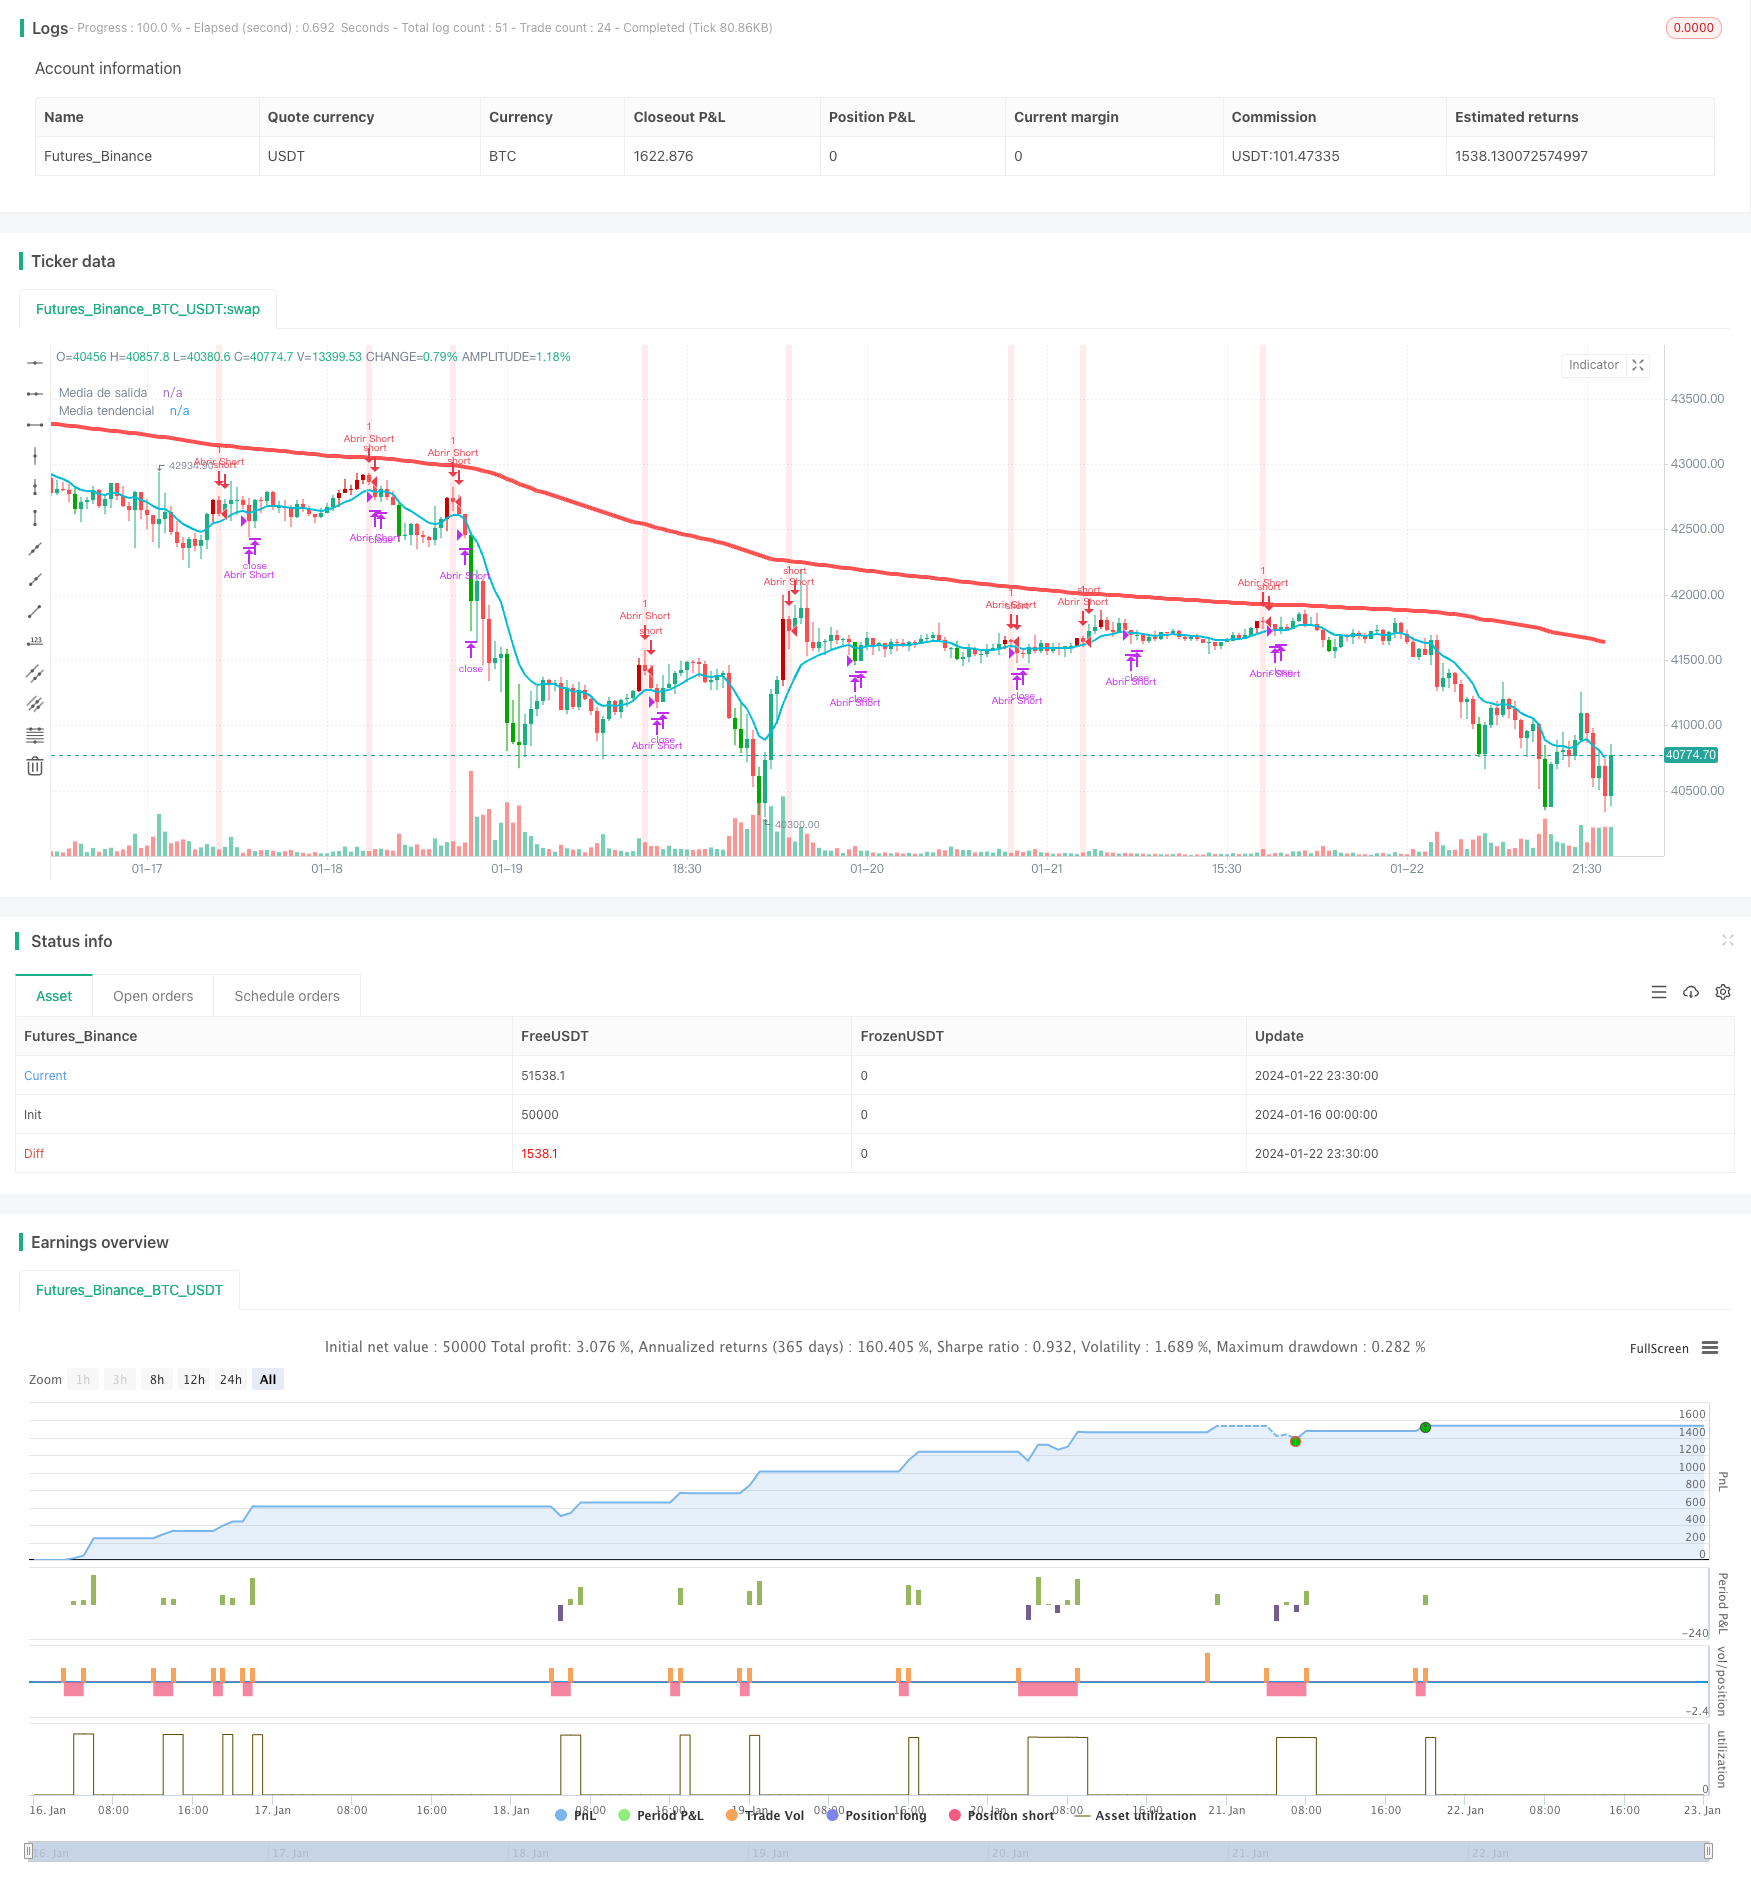
/*backtest
start: 2024-01-16 00:00:00
end: 2024-01-23 00:00:00
period: 30m
basePeriod: 15m
exchanges: [{"eid":"Futures_Binance","currency":"BTC_USDT"}]
*/

// This source code is subject to the terms of the Mozilla Public License 2.0 at https://mozilla.org/MPL/2.0/
// © JoseMetal
//@version=5

//== Constantes
c_blanco              = color.rgb(255, 255, 255, 0)
c_negro               = color.rgb(0, 0, 0, 0)
c_amarillo_radiactivo = color.rgb(255, 255, 0, 0)
c_cian_radiactivo     = color.rgb(0, 255, 255, 0)
c_verde_radiactivo    = color.rgb(0, 255, 0, 0)
c_verde               = color.rgb(0, 128, 0, 0)
c_verde_oscuro        = color.rgb(0, 80, 0, 0)
c_rojo_radiactivo     = color.rgb(255, 0, 0, 0)
c_rojo                = color.rgb(128, 0, 0, 0)
c_rojo_oscuro         = color.rgb(80, 0, 0, 0)
c_naranja_oscuro      = color.rgb(200, 120, 0, 0)
noneColor             = color.new(color.white, 100)
max_float             = 10000000000.0


//== Funciones

//== Declarar estrategia y período de testeo
strategy("Estrategia Larry Connors", shorttitle="Estrategia Larry Connors", overlay=true)
fecha_inicio     = input(timestamp("1 Jan 2000"), title="• Fecha de inicio", group="Período de pruebas", inline="periodo_de_pruebas")
vela_en_fecha    = true
posicion_abierta = strategy.position_size != 0
LONG_abierto     = strategy.position_size > 0
SHORT_abierto    = strategy.position_size < 0

GRUPO_P           = "Posiciones"
P_permitir_LONGS  = input.bool(title="LONGS", group=GRUPO_P, defval=true, inline="posiciones")
P_permitir_SHORTS = input.bool(title="SHORTS", group=GRUPO_P, defval=true, inline="posiciones")

GRUPO_general = "General"
mostrar_color_velas = input.bool(title="Colorear velas", defval=true, group=GRUPO_general)


//== Inputs de indicadores
// Medias móviles simples
GRUPO_SMAs = "SMAs"
SMA_1_fuente = input.source(title="• (Media de salida) Fuente / Long.", group=GRUPO_SMAs, defval=close, inline="sma_1")
SMA_1_length = input.int(title="", group=GRUPO_SMAs, defval=10, minval=1, inline="sma_1")
SMA_2_fuente = input.source(title="• (Media tendencial) Fuente / Long.", group=GRUPO_SMAs, defval=close, inline="sma_2")
SMA_2_length = input.int(title="", group=GRUPO_SMAs, defval=200, minval=1, inline="sma_2")
SMA_1        = ta.ema(SMA_1_fuente, SMA_1_length)
SMA_2        = ta.ema(SMA_2_fuente, SMA_2_length)

// RSI
GRUPO_RSI    = "RSI"
RSI_src      = input.source(title="• Fuente / Longitud", group=GRUPO_RSI, defval=close, inline="rsi_calc")
RSI_length   = input.int(title="", group=GRUPO_RSI, defval=2, minval=1, inline="rsi_calc")
RSI          = ta.rsi(RSI_src, RSI_length)
RSI_nivel_os = input.int(title="• Sobreventa / Sobrecompra", group=GRUPO_RSI, defval=5, minval=0, maxval=99, inline="rsi_niveles")
RSI_nivel_ob = input.int(title="", group=GRUPO_RSI, defval=95, minval=1, maxval=100, inline="rsi_niveles")


//== Cálculo de condiciones
cierre_sobre_SMA_1 = close > SMA_1
tendencia_alcista  = close > SMA_2
RSI_en_sobreventa  = RSI < RSI_nivel_os
RSI_en_sobrecompra = RSI > RSI_nivel_ob


//== Entrada (deben cumplirse todas para entrar)
LONG_condition_1    = tendencia_alcista
LONG_condition_2    = not cierre_sobre_SMA_1 // Vela con cierre bajo la media rápida
LONG_condition_3    = RSI_en_sobreventa[1] and not RSI_en_sobreventa // Sobreventa en la vela anterior y ya no en la actual
all_LONG_conditions = LONG_condition_1 and LONG_condition_2 and LONG_condition_3
entrar_en_LONG      = P_permitir_LONGS and all_LONG_conditions and vela_en_fecha and not LONG_abierto

SHORT_condition_1    = not tendencia_alcista
SHORT_condition_2    = cierre_sobre_SMA_1 // Vela con cierre sobre la media rápida
SHORT_condition_3    = RSI_en_sobrecompra[1] and not RSI_en_sobrecompra // Sobrecompra en la vela anterior y ya no en la actual
all_SHORT_conditions = SHORT_condition_1 and SHORT_condition_2 and SHORT_condition_3
entrar_en_SHORT      = P_permitir_SHORTS and all_SHORT_conditions and vela_en_fecha and not SHORT_abierto

if (entrar_en_LONG)
    strategy.entry("Abrir Long", strategy.long)

if (entrar_en_SHORT)
    strategy.entry("Abrir Short", strategy.short)


//== Salida
exit_LONG_conditions  = cierre_sobre_SMA_1
exit_SHORT_conditions = not cierre_sobre_SMA_1


if (LONG_abierto and exit_LONG_conditions)
    strategy.close("Abrir Long")

if (SHORT_abierto and exit_SHORT_conditions)
    strategy.close("Abrir Short")


//== Ploteo en pantalla
// SMAs
plot(SMA_1, "Media de salida", color=color.aqua, linewidth=2)
plot(SMA_2, "Media tendencial", color=tendencia_alcista ? color.green : color.red, linewidth=4)

// Color de fondo
bgcolor = entrar_en_LONG ? color.new(color.green, 85) : entrar_en_SHORT ? color.new(color.red, 85) : color.new(color.black, 100)
bgcolor(bgcolor)

// Color de las velas según sobrecompra/sobreventa del RSI
color_velas = mostrar_color_velas ? (RSI_en_sobreventa ? #00a800 : RSI_en_sobrecompra ? #ca0000 : na) : na
barcolor(color_velas)