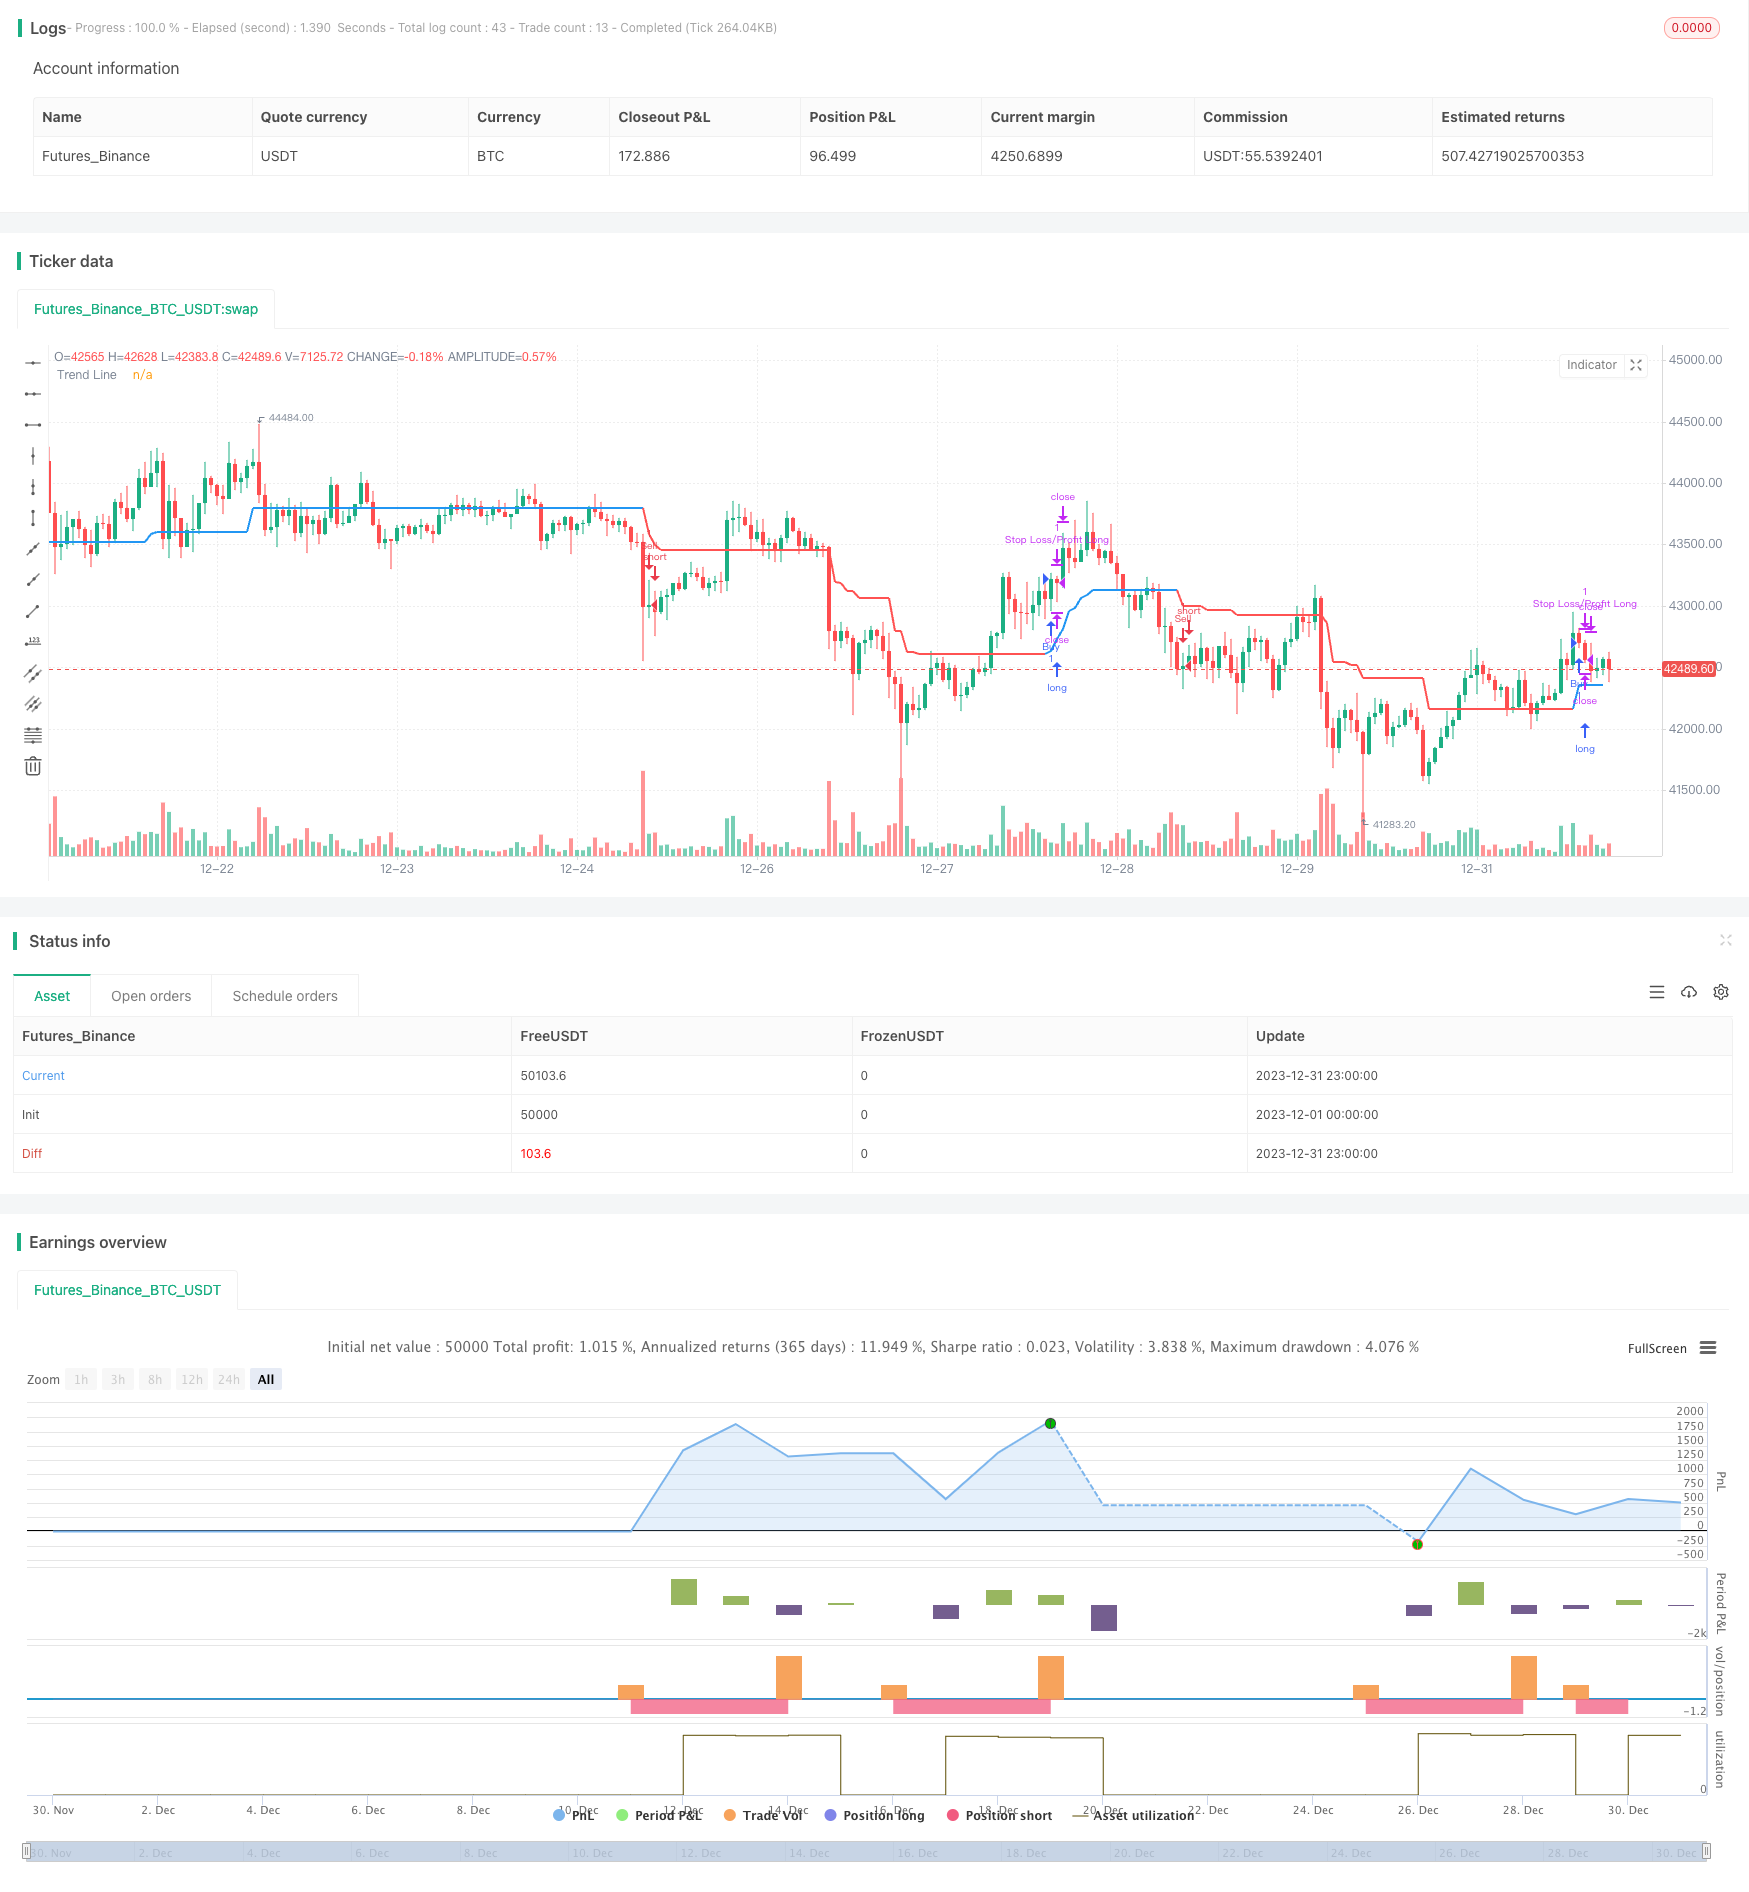
概述
这是一个基于布林带指标判断趋势,并利用ATR指标设定止损止盈的趋势追踪策略。该策略首先判断市场趋势,在IRONMENT线,并在平仓时设定止损止盈点。
策略原理
- 计算布林带的上轨、下轨。
- 判断收盘价是否高于上轨或低于下轨,如果是则判断为趋势市场,分别为多头和空头市场。
- 如果是趋势市场,则计算环境线。环境线基于最低价减去ATR的值(多头市场)或最高价加上ATR的值(空头市场)。
- 如果不是趋势市场,则环境线保持与前一根K线的环境线值相同。
- 比较ENVIRONMENT线,判断趋势方向。如果上升为多头,下跌为空头。
- 在ENVIRONMENT线方向转变时,产生买入/卖出信号。
- 设置止损止盈:固定止损距离为入场价的100倍;浮动止盈距离为入场价的1.1倍(多头)或0.9倍(空头)。
优势分析
- 能够判断市场趋势,减少假突破操作。
- 设定ENVIRONMENT线,避免被套。
- 止损止盈设置合理,能够在保证盈利的同时控制风险。
风险分析
- 参数设置不当可能导致错失交易机会。
- 布林带指标在震荡行情中判断错误概率较大。
- 止损点过于接近可能被秒出场。
优化方向
- 优化布林带的参数,使之更适合不同品种。
- 优化ENVIRONMENT线的计算方式,如引入其他指标等。
- 测试并优化止损止盈的参数设置。
总结
这是一个以布林带判断趋势,利用ENVIRONMENT线设置止损止盈的策略。核心优势是趋势判断清晰、止损止盈设置合理,能有效控制风险。主要风险在于布林带趋势判断错误和止损点过近。未来优化方向包括参数优化、ENVIRONMENT线计算方式优化和止损止盈优化等。
策略源码
/*backtest
start: 2023-12-01 00:00:00
end: 2023-12-31 23:59:59
period: 1h
basePeriod: 15m
exchanges: [{"eid":"Futures_Binance","currency":"BTC_USDT"}]
*/

// This Pine Script™ code is subject to the terms of the Mozilla Public License 2.0 at https://mozilla.org/MPL/2.0/
// © zhuenrong

// © Dreadblitz
//@version=4
strategy(shorttitle="FLI", title="Follow Line Indicator", overlay=true)
//
BBperiod      = input(defval = 21,     title = "BB Period",    type = input.integer, minval = 1)
BBdeviations  = input(defval = 1.00,     title = "BB Deviations",    type = input.float, minval = 0.1, step=0.05)
UseATRfilter  = input(defval = true, title = "ATR Filter",  type = input.bool)
ATRperiod     = input(defval = 5,     title = "ATR Period",    type = input.integer, minval = 1)
hl            = input(defval = false, title = "Hide Labels",  type = input.bool)
//
BBUpper=sma (close,BBperiod)+stdev(close, BBperiod)*BBdeviations
BBLower=sma (close,BBperiod)-stdev(close, BBperiod)*BBdeviations
//
TrendLine = 0.0
iTrend = 0.0
buy = 0.0
sell = 0.0
//
BBSignal = close>BBUpper? 1 : close<BBLower? -1 : 0
//
if BBSignal == 1 and UseATRfilter == 1
    TrendLine:=low-atr(ATRperiod)
    if TrendLine<TrendLine[1]
        TrendLine:=TrendLine[1]
if BBSignal == -1 and UseATRfilter == 1
    TrendLine:=high+atr(ATRperiod)
    if TrendLine>TrendLine[1]
        TrendLine:=TrendLine[1]
if BBSignal == 0 and UseATRfilter == 1
    TrendLine:=TrendLine[1]
//
if BBSignal == 1 and UseATRfilter == 0
    TrendLine:=low
    if TrendLine<TrendLine[1]
        TrendLine:=TrendLine[1]
if BBSignal == -1 and UseATRfilter == 0
    TrendLine:=high
    if TrendLine>TrendLine[1]
        TrendLine:=TrendLine[1]
if BBSignal == 0 and UseATRfilter == 0
    TrendLine:=TrendLine[1]
//
iTrend:=iTrend[1]
if TrendLine>TrendLine[1]
    iTrend:=1
if TrendLine<TrendLine[1]
    iTrend:=-1
//
buy:=iTrend[1]==-1 and iTrend==1 ? 1 : na
sell:=iTrend[1]==1 and iTrend==-1? 1 : na
//
plot(TrendLine, color=iTrend > 0?color.blue:color.red ,style=plot.style_line,linewidth=2,transp=0,title="Trend Line")
plotshape(buy == 1 and hl == false? TrendLine-atr(8) :na, text='💣', style= shape.labelup, location=location.absolute, color=color.blue, textcolor=color.white, offset=0, transp=0,size=size.auto)
plotshape(sell == 1 and hl == false ?TrendLine+atr(8):na, text='🔨', style=shape.labeldown, location=location.absolute, color=color.red, textcolor=color.white, offset=0, transp=0,size=size.auto)
//
alertcondition(sell == 1 ,title="Sell",message="Sell")
alertcondition(buy == 1 ,title="Buy",message="Buy")
alertcondition(buy == 1 or sell == 1 ,title="Buy/Sell",message="Buy/Sell")
if (buy==1)
    strategy.entry("Buy", strategy.long)
if (sell==1)
    strategy.entry("Sell", strategy.short)
// === Stop LOSS ===

if strategy.position_size>0
    strategy.exit("Stop Loss/Profit Long","Buy", stop=strategy.position_avg_price*100, limit=strategy.position_avg_price*1.1)
if strategy.position_size<0
    strategy.exit("Stop Loss/Profit Short","Sell", stop=strategy.position_avg_price*100, limit=strategy.position_avg_price*0.9)