概述
本策略旨在利用指数移动平均线和基于Chande动态汇聚散度平均真实范围的游离停止来发现潜在的趋势反转或延续。该策略结合多个指标判断入场时机,并设定基于市场波动性的止损和止盈水平,力求在发现新趋势的同时控制风险。
策略原理
本策略使用60周期和90周期的双EMA判断趋势方向。当短周期EMA上穿长周期EMA时为看涨信号。同时,MACD的快线上穿慢线也可确认看涨。入场时要求价格高于之前计算出的CDC游离停止位。
策略出场规则为:价格触碰基于ATR的止盈位或下破CDC游离止损位时平仓。
优势分析
该策略结合双EMA判断主趋势方向和MACD确认入场时机,避免了假突破。游离停止位和止盈位都基于市场的波动性计算,能够很好地管理风险。无论趋势反转还是延续,该策略都能及时抓住机会。
另外,该策略输入参数可自定义,用户可根据需要调整EMA周期、ATR周期和CDC系数等,使策略更贴合自己的交易方式。
风险分析
本策略最大的风险在于趋势判断出错。当市场处于盘整时,EMA容易发出错误信号。这时,MACD指标的确认作用尤为重要。此外,应适当调大CDC止损系数来应对突发事件导致的大幅跳空。
优化方向
- 测试调整EMA周期参数,寻找最佳参数组合
- 测试不同的CDC止损系数大小
- 尝试结合其他指标过滤入场时机
- 增加对突发事件的处理机制
总结
本策略充分利用了趋势判断和波动性指标的优势,能够识别出标的证券中的潜在机会。通过参数优化和机制改进,该策略有望进一步增强稳定性和获利能力。它为量化交易者提供了一个可靠、可扩展的策略框架。
策略源码
/*backtest
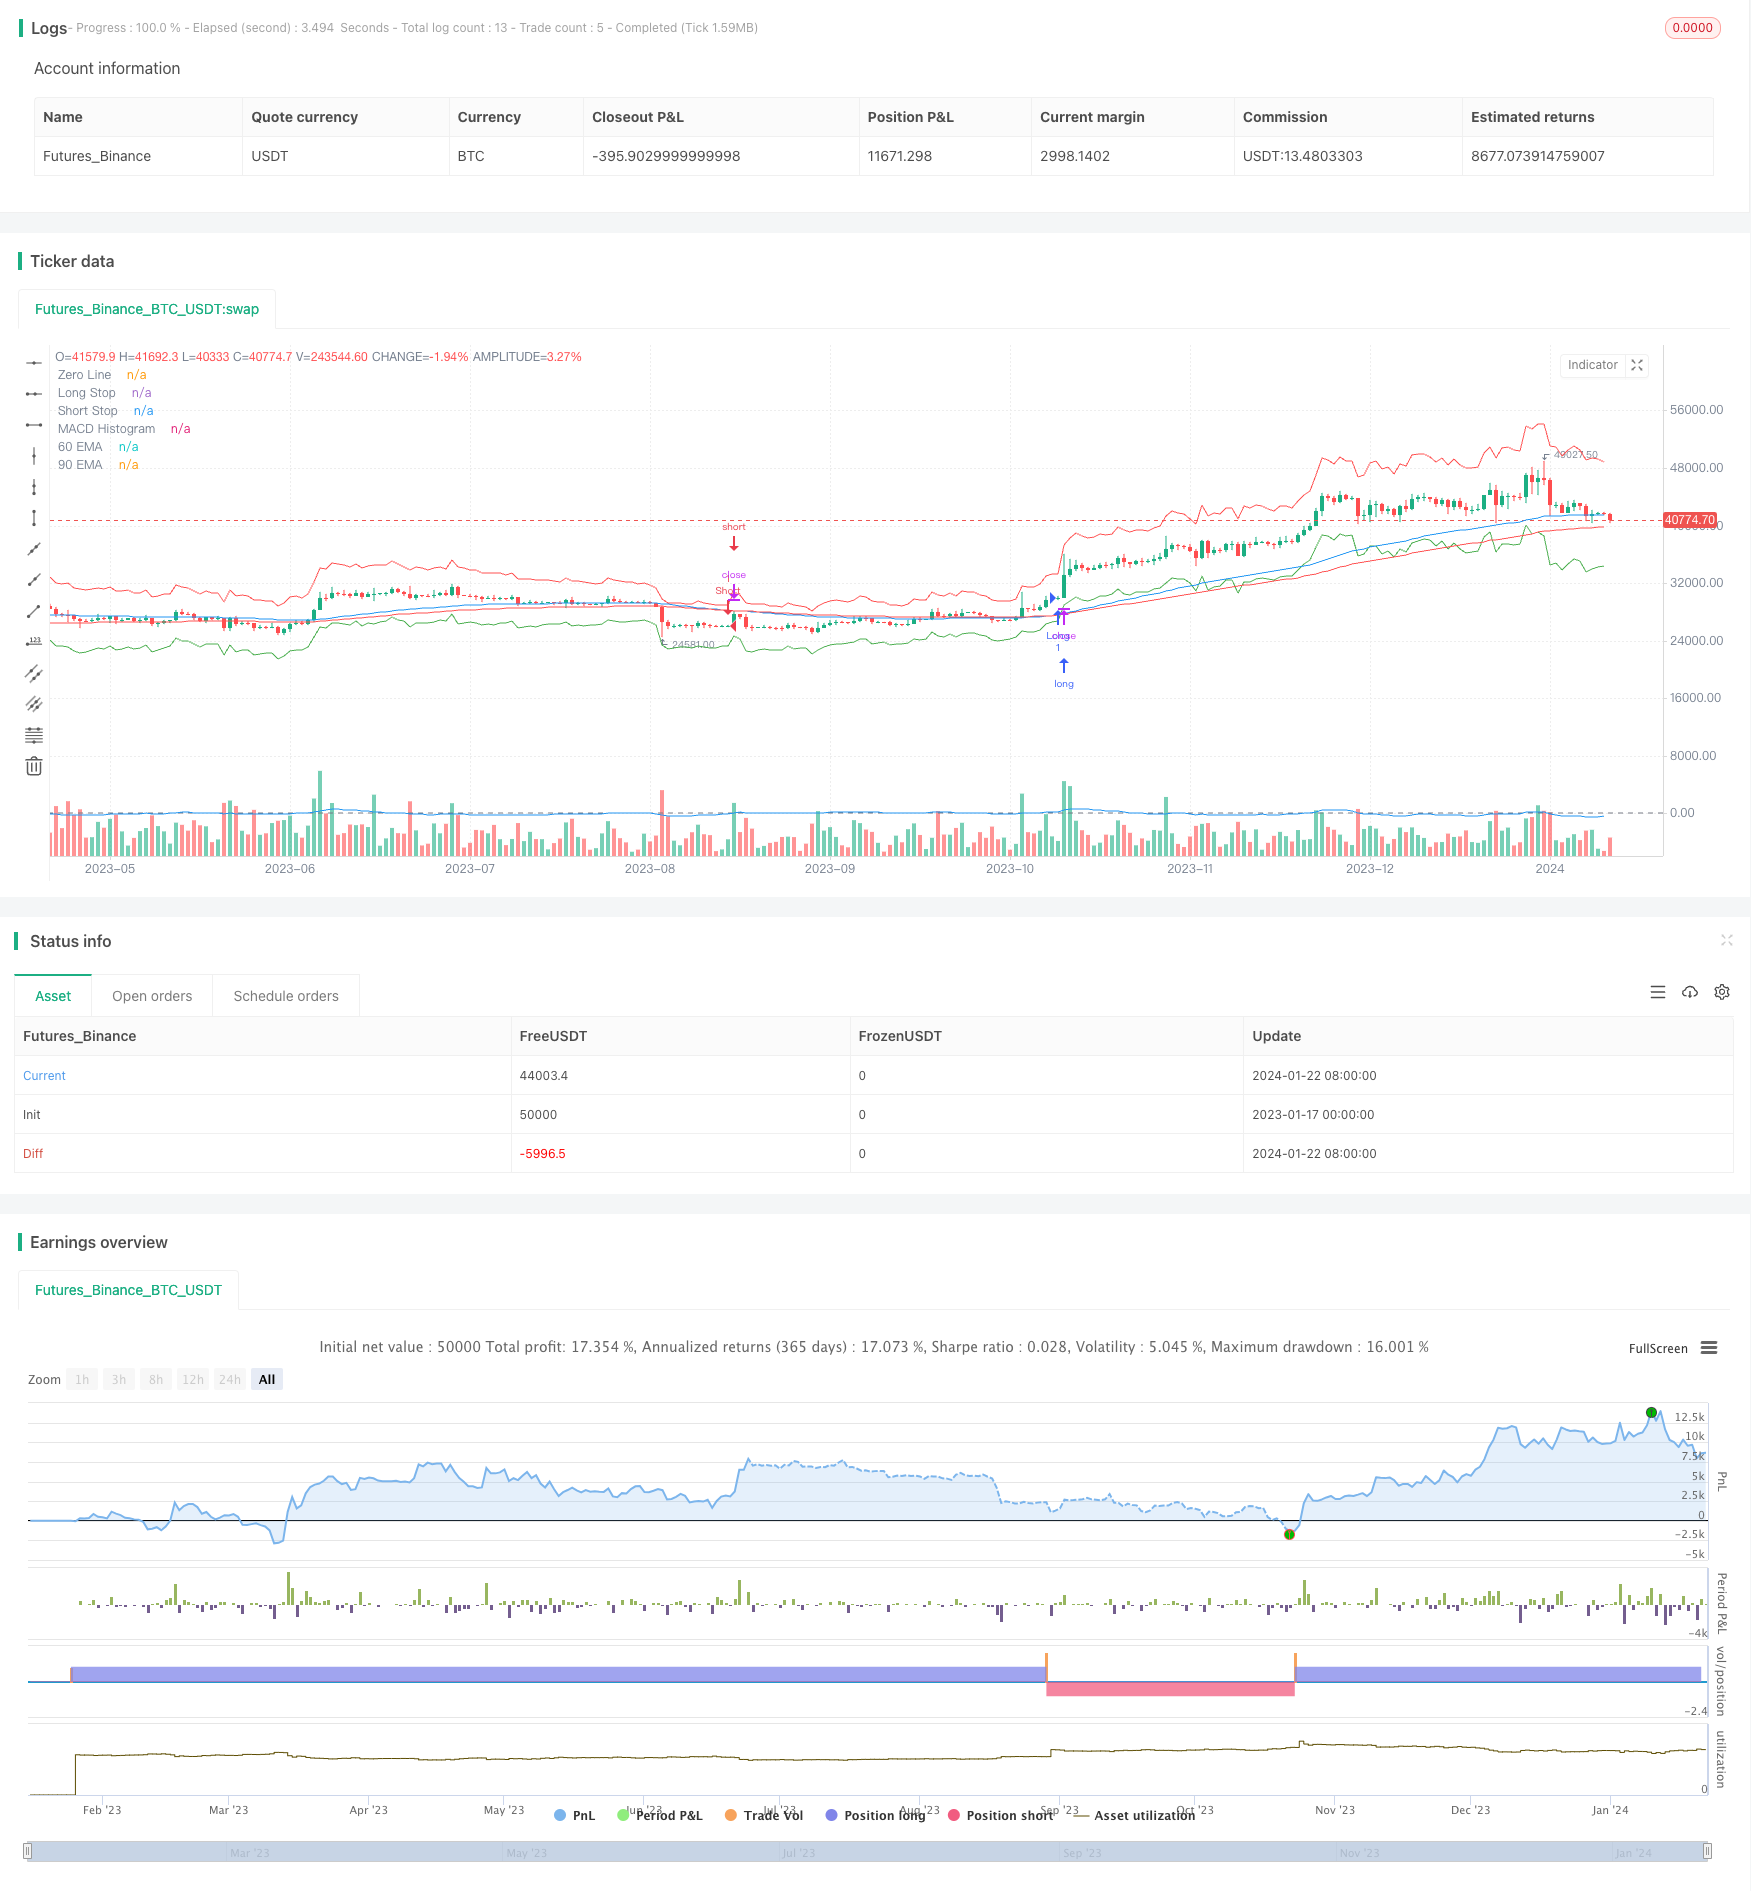
start: 2023-01-17 00:00:00
end: 2024-01-23 00:00:00
period: 1d
basePeriod: 1h
exchanges: [{"eid":"Futures_Binance","currency":"BTC_USDT"}]
*/
//@version=5
strategy("Improved EMA & CDC Trailing Stop Strategy", overlay=true)
// Define the inputs
ema60Period = input(60, title="EMA 60 Period")
ema90Period = input(90, title="EMA 90 Period")
atrPeriod = input(24, title="CDC ATR Period")
multiplier = input(4.0, title="CDC Multiplier")
profitTargetMultiplier = input(2.0, title="Profit Target Multiplier (ATR)")
// Calculate EMAs
ema60 = ta.ema(close, ema60Period)
ema90 = ta.ema(close, ema90Period)
// Calculate ATR
atr = ta.atr(atrPeriod)
// MACD calculation
[macdLine, signalLine, _] = ta.macd(close, 12, 26, 9)
// Define the trailing stop and profit target
longStop = close - multiplier * atr
shortStop = close + multiplier * atr
longProfitTarget = close + profitTargetMultiplier * atr
shortProfitTarget = close - profitTargetMultiplier * atr
// Entry conditions
longCondition = close > ema60 and ema60 > ema90 and macdLine > signalLine and close > longStop
shortCondition = close < ema60 and ema60 < ema90 and macdLine < signalLine and close < shortStop
// Exit conditions based on profit target
longProfitCondition = close >= longProfitTarget
shortProfitCondition = close <= shortProfitTarget
// Plot the EMAs, Stops, and MACD for visualization
plot(ema60, color=color.blue, title="60 EMA")
plot(ema90, color=color.red, title="90 EMA")
plot(longStop, color=color.green, title="Long Stop", style=plot.style_linebr)
plot(shortStop, color=color.red, title="Short Stop", style=plot.style_linebr)
hline(0, "Zero Line", color=color.gray)
plot(macdLine - signalLine, color=color.blue, title="MACD Histogram")
// Strategy execution using conditional blocks
if longCondition
strategy.entry("Long", strategy.long)
if shortCondition
strategy.entry("Short", strategy.short)
// Exit based on profit target and trailing stop
if longProfitCondition or close < longStop
strategy.close("Long")
if shortProfitCondition or close > shortStop
strategy.close("Short")